
|
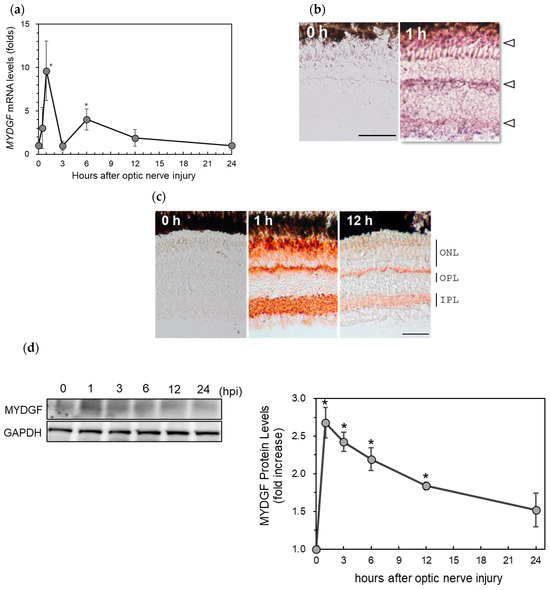
Fig. 1 The upregulation of MYDGF (myeloid-derived growth factor) in the zebrafish retina after ONI (optic nerve injury). (a) MYDGF mRNA expression levels after ONI were determined using quantitative real-time PCR. Gene expression levels were normalized to GAPDH as an internal control, and fold changes were calculated relative to the 0 h (untreated) baseline group using the ΔΔCt method. Statistical analysis was performed using one-way ANOVAs, followed by Scheffe’s multiple-comparison tests. Data are expressed as the means ± SEMs (n = 6–7), with statistical significance set at * p < 0.05. (b) In situ hybridization of MYDGF in the zebrafish retina after ONI. MYDGF mRNA peaked in the retina 1 h after ONI, and it was observed in three locations in the retina, as indicated by the arrowheads. (c) Immunohistochemical staining of MYDGF in the zebrafish retina after ONI. Significant immunostaining peaked at 1 h in outer nuclear layers (ONLs), the border of the ONLs and outer plexiform layers (OPLs), and the inner plexiform layers (IPLs). Scale bar = 50 μm. Representative images from 3–4 independent experiments of in situ hybridization and IHC are shown. (d) Western blot analysis of MYDGF expression in the zebrafish retina at 0–24 h after ONI. MYDGF protein levels peaked in the retina 1 h after ONI. Data are expressed as the means ± SEMs (n = 3), with statistical significance set at * p < 0.05.