
|
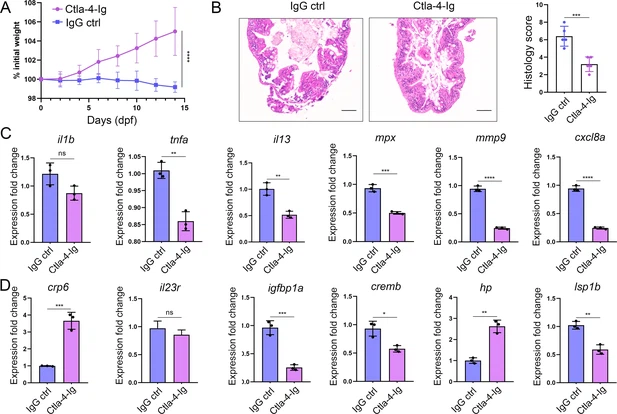
Fig. 8 In vivo inhibition of intestinal inflammation by sCtla-4-Ig. (A) Percent initial weight of zebrafish after injection of the sCtla-4-Ig or the IgG isotype control. Each group consisted of six zebrafish (n=6). Data show means with SEM analyzed by two-way ANOVA with Sidak’s correction for multiple comparisons. (B) Representative H&E staining analysis of histopathological changes and quantitation of histology scores in the posterior intestine from ctla-4-/- zebrafish treated with sCtla-4-Ig or IgG isotype control. Scale bar: 50 μm. (C) The mRNA expression levels of inflammation-related genes in ctla-4-/- zebrafish treated with sCtla-4-Ig or IgG isotype control. (D) The mRNA expression levels of IBD biomarker genes and IBD-related genes in ctla-4-/- zebrafish treated with sCtla-4-Ig or IgG isotype control. The p-value was generated by an unpaired two-tailed Student’s t-test. **p < 0.01; ***p < 0.001; ****p < 0.0001.