IMAGE

Fig. 6

ID
ZDB-IMAGE-250609-82
Source
Figures for Eski et al., 2025
Image
Figure Caption

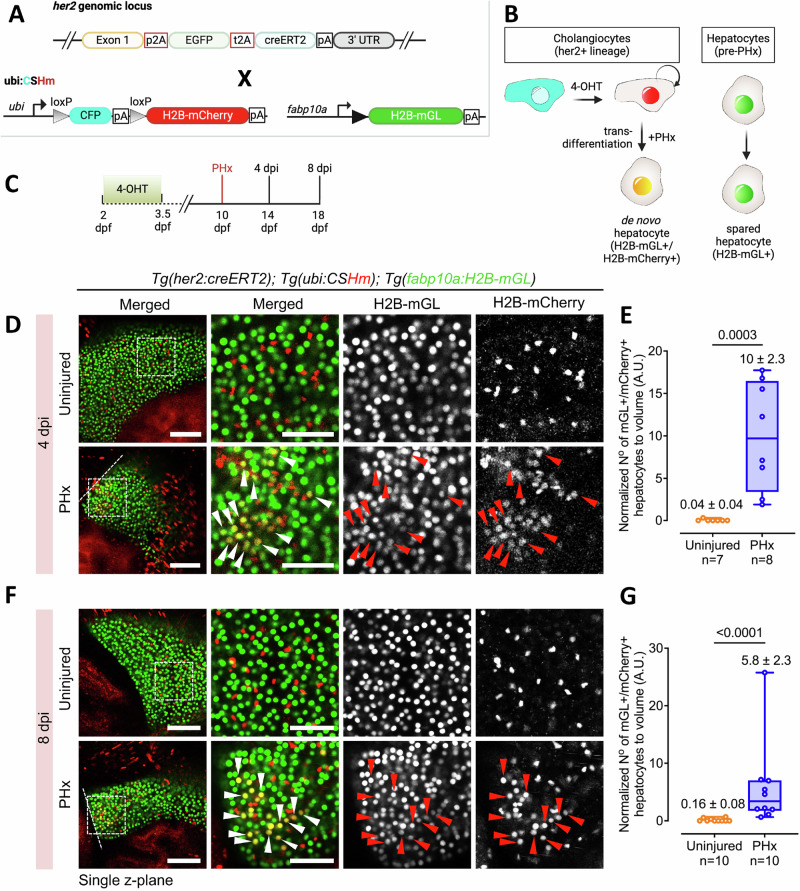
Fig. 6 her2+ cells generate hepatocytes after PHx.

A The transgenic lines used to lineage trace her2+ cells. B Schematic illustrating the tracing of her2 + -derived hepatocytes following PHx. C Experimental timeline for lineage tracing. D, F Live confocal images of left lobe in uninjured and PHx condition at 4 dpi (D) and at 8 dpi (F). Representative cholangiocyte-derived de novo hepatocytes are marked with arrowheads. Dashed line marks the border of the regenerate. E, G Min-to-max box plots showing the normalized number of H2B-mGL+/mCherry+ hepatocytes per unit volume at 4 dpi (E) and 8 dpi (G). Each dot represents one animal; mean ± SEM is indicated above each box. Statistical significance was assessed using the Two-tailed Mann–Whitney test. Sample sizes are indicated below the respective groups. Scale bars: 100 μm (left panels), 50 μm (insets) (D, F).

Acknowledgments
This image is the copyrighted work of the attributed author or publisher, and ZFIN has permission only to display this image to its users. Additional permissions should be obtained from the applicable author or publisher of the image. Full text @ Nat. Commun.