IMAGE

Fig. 2

ID
ZDB-IMAGE-250609-78
Source
Figures for Eski et al., 2025
Image
Figure Caption

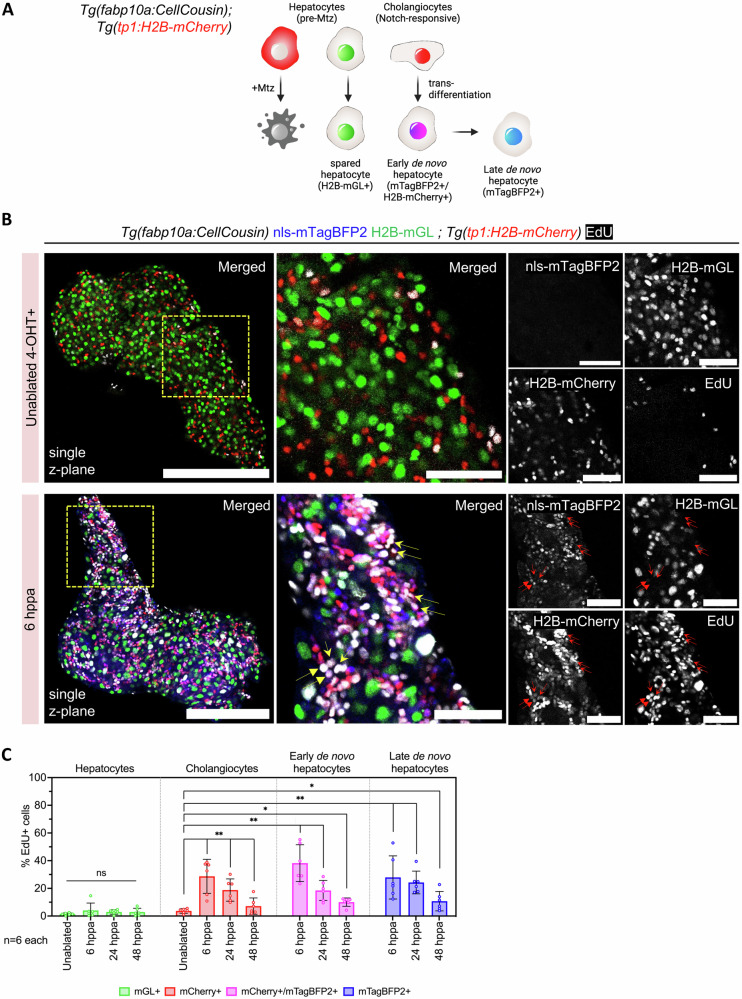
Fig. 2 Cholangiocytes proliferate in response to partial ablation of hepatocytes.

A Schematic illustrating the lineage tracing of cholangiocytes after partial ablation via the CellCousin method. Hepatocytes are labeled with H2B-mGL+ or mCherry-NTR+ after 4-OHT treatment in the Tg(fabp10a:CellCousin) line. Cholangiocytes, which are Notch-responsive, are marked with bright H2B-mCherry+ (nuclear red) using the Tg(tp1:H2B-mCherry) line. After MTZ administration, Specific ablation of mCherry-NTR+ hepatocytes leads to a liver with spared H2B-mGL+ hepatocytes and de novo nls-mTagBFP2+ hepatocytes. Early de novo hepatocytes derived from cholangiocytes are detected as nls-mTagBFP2 + /H2B-mCherry+ (nuclear magenta), while late de novo hepatocytes, due to dilution of H2B-mCherry label, are marked only with nls-mTagBFP2. B Confocal images of livers from EdU labeled uninjured and 6 hppa Tg(fabp10a:CellCousin); Tg(tp1:H2B-mCherry) transgenic animals. Arrows mark proliferating early de novo hepatocytes. Scale bar: 200 μm (left panels), 50 μm (insets). C Barplot with Mean ± SD showing quantification of the percentage of EdU+ hepatocytes, cholangiocytes, and early and late de novo hepatocytes in uninjured, 6 dppa, 24 dppa and 48 dppa (n = 6 animals). (ANOVA, followed by pair wise comparison using Two-Tailed Mann Whitney. For cholangiocytes and de novo hepatocytes, comparison with uninjured cholangiocytes is shown. ** p-value = 0.0022; * p-value < 0.05).

Acknowledgments
This image is the copyrighted work of the attributed author or publisher, and ZFIN has permission only to display this image to its users. Additional permissions should be obtained from the applicable author or publisher of the image. Full text @ Nat. Commun.