
Image
|
Figure Caption
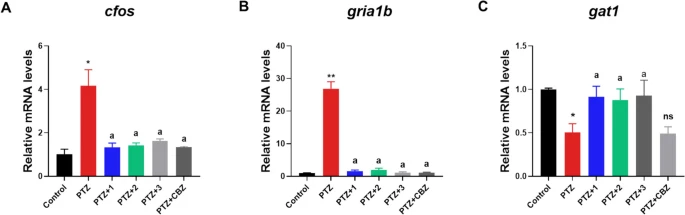
Fig. 5 A, B, and C Changes in gene expression for the control and compounds 1 − 3 (5 μg/mL) treated groups before and after PTZ treatment, as shown for c-fos, gria1b, and gat1 expression level (Mean ± S.D; ** p < 0.01, * p < 0.05; The same lowercase letters indicate no significant differences among the rescue groups; ns, no significance)
Acknowledgments
This image is the copyrighted work of the attributed author or publisher, and
ZFIN has permission only to display this image to its users.
Additional permissions should be obtained from the applicable author or publisher of the image.
Full text @ Mar. Biotechnol.