
|
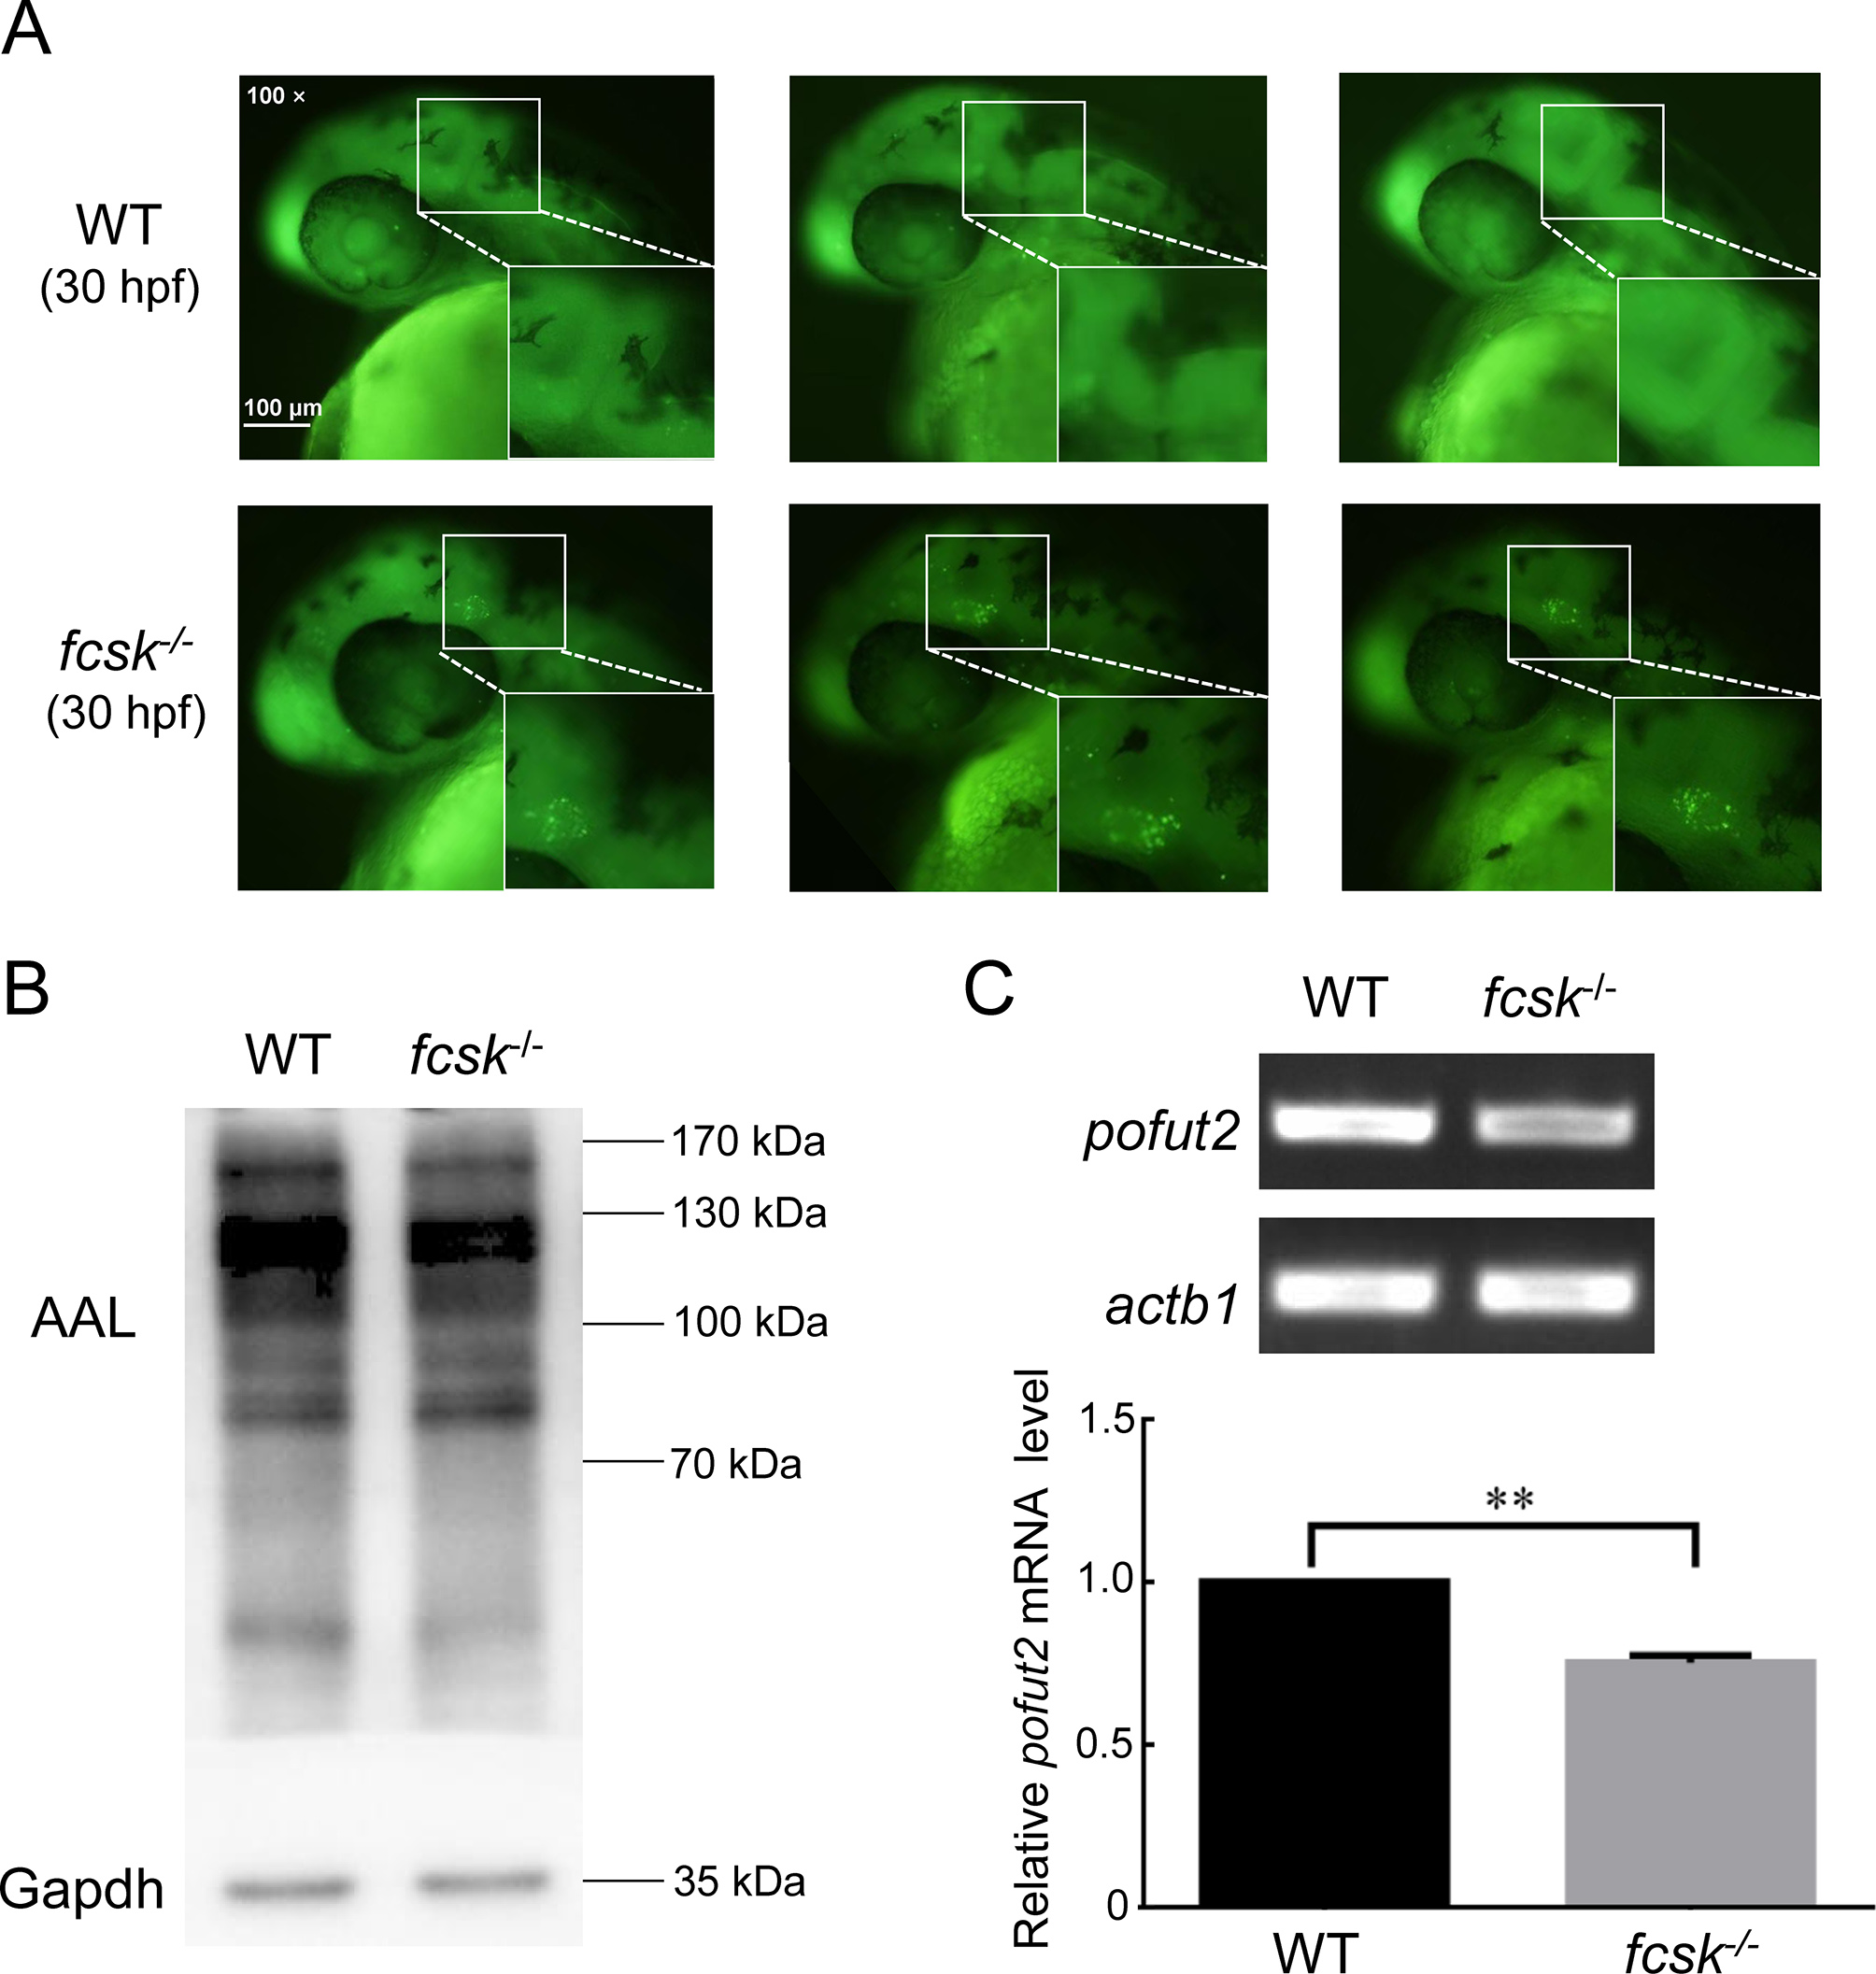
Fig. 5 Increased apoptosis in midbrain-hindbrain boundary and decreased expression of fucosylated proteins and pofut2 in fcsk−/− zebrafish A: Representative acridine orange (AO) staining results of WT (n=22) and fcsk−/− (n=21) larvae (30 hpf). White box: Mid-hindbrain boundary. Enlarged images of white boxed areas are shown in lower right corner. Scale bar: 100 μm. B: Western and lectin blot analyses of WT and fcsk−/− zebrafish at 5 dpf. Gapdh was used as an internal control. n=20 larvae (5 dpf) per genotype. AAL: Aleuria aurantia lectin. n=3. C: Agarose gel electrophoresis (upper) and statistical analysis (lower) of semi-quantitative RT-PCR for pofut2 expression in WT and fcsk−/− zebrafish (5 dpf). n=3. Mean±SEM. **: P<0.01.