
Image
|
Figure Caption
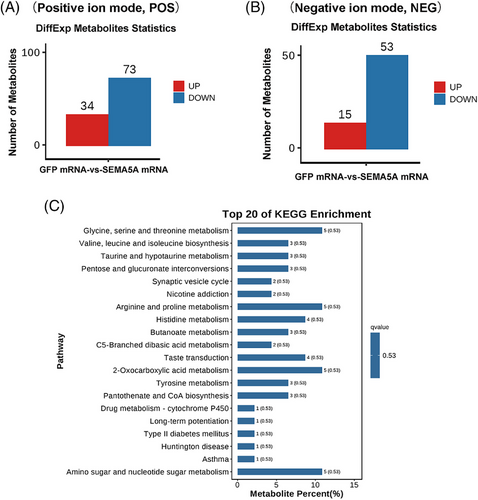
Fig. 6 Metabolomic alteration of SEMA5A overexpression in zebrafish early embryos (4.5 hpf). (A, B) Statistical bar chart of differentially expressed metabolites are depicted (POS mode and NEG mode). (C) The top 20 enriched KEGG pathways.
Acknowledgments
This image is the copyrighted work of the attributed author or publisher, and
ZFIN has permission only to display this image to its users.
Additional permissions should be obtained from the applicable author or publisher of the image.
Full text @ Andrology