
|
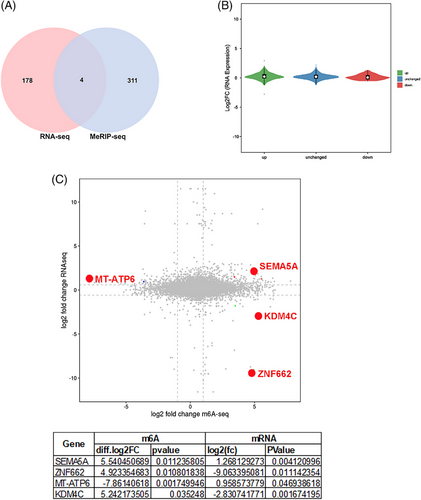
Fig. 2 Identification of differential genes in unexplained recurrent pregnancy loss (URPL) spermatozoa by RNA-seq and m6A-seq. (A) Venn diagram shows four significantly co-regulated genes (both N6-methyladenosine [m6A] level and gene expression) in URPL spermatozoa compared to control groups. (B) Violin plot shows the distribution of genes with both m6A methylation level (up, unchanged, and down by X-axis) and gene expression level (Y-axis) in URPL spermatozoa with control groups. (C) The starplot presented the distribution of genes with both differential (hyper or hypo) m6A methylation level (Y-axis) and differential (up or down) gene expression level (X-axis) in URPL spermatozoa compared with control groups. The table shows the detailed data of the four genes