
Fig. 5
- ID
- ZDB-IMAGE-250401-14
- Publication
- Zhang et al., 2024 - Morpho-histological and Transcriptome Analysis Reveal the Unreduced Sperm Formation Mechanism in cdk1-Depletion Zebrafish
- All Figures
- Figures for Zhang et al., 2024
|
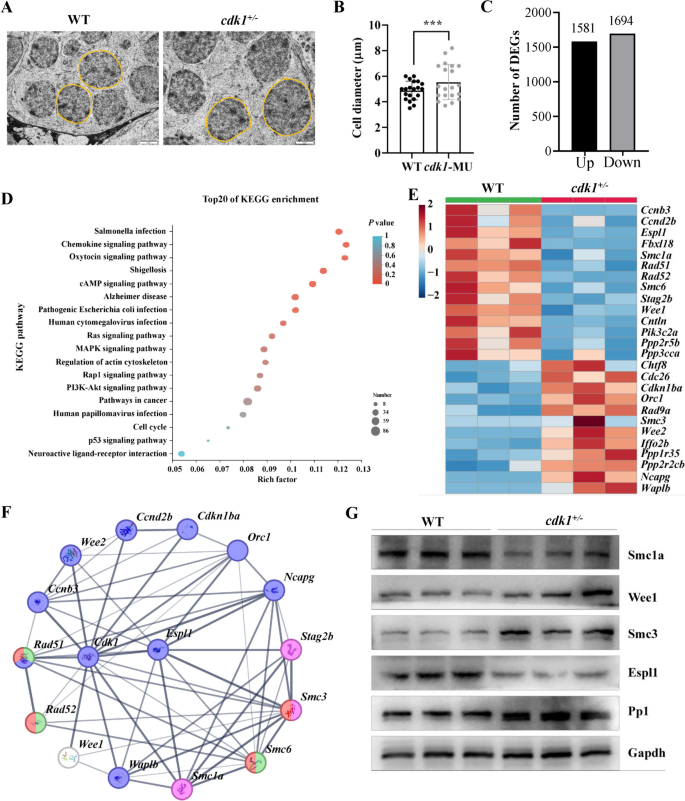
Fig. 5 Electron microscopic observation of WT and cdk1+/− zebrafish spermatogonia and transcriptome analysis of testis. A The ultrastructures of spermatogonia from WT and cdk1+/− zebrafish. Scale bar = 2 µm. B Measurement of spermatogonia diameter of WT and cdk1+/− zebrafish. C The numbers of up-regulated and down-regulated DEGs of cdk1+/− vs WT zebrafish. D KEGG pathway enrichment analysis of DEGs between WT and cdk1+/− zebrafish. E Expression heatmap of cell cycle-related genes. F Network interaction analysis of DEGs corresponding proteins. G Expression levels of Smc1a, Wee1, Smc3, Espl1, and Pp1 protein in the testes of WT and cdk1+/− zebrafish. cdk1, cyclin-dependent kinase 1; WT, wild-type zebrafish; cdk1+/−, zebrafish with heterozygous mutation of cdk1; DEGs, differentially expressed genes; KEGG, Kyoto Encyclopedia of Genes and Genomes