IMAGE

FIGURE 2

ID
ZDB-IMAGE-250226-37
Source
Figures for Tanifuji et al., 2025
Image
Figure Caption

FIGURE 2

Angiotensin II (AngII) attenuated elastic fiber formation in the adult zebrafish dorsal aorta. (a) Representative images of Elastica van Gieson–stained transverse sections of the dorsal aorta of
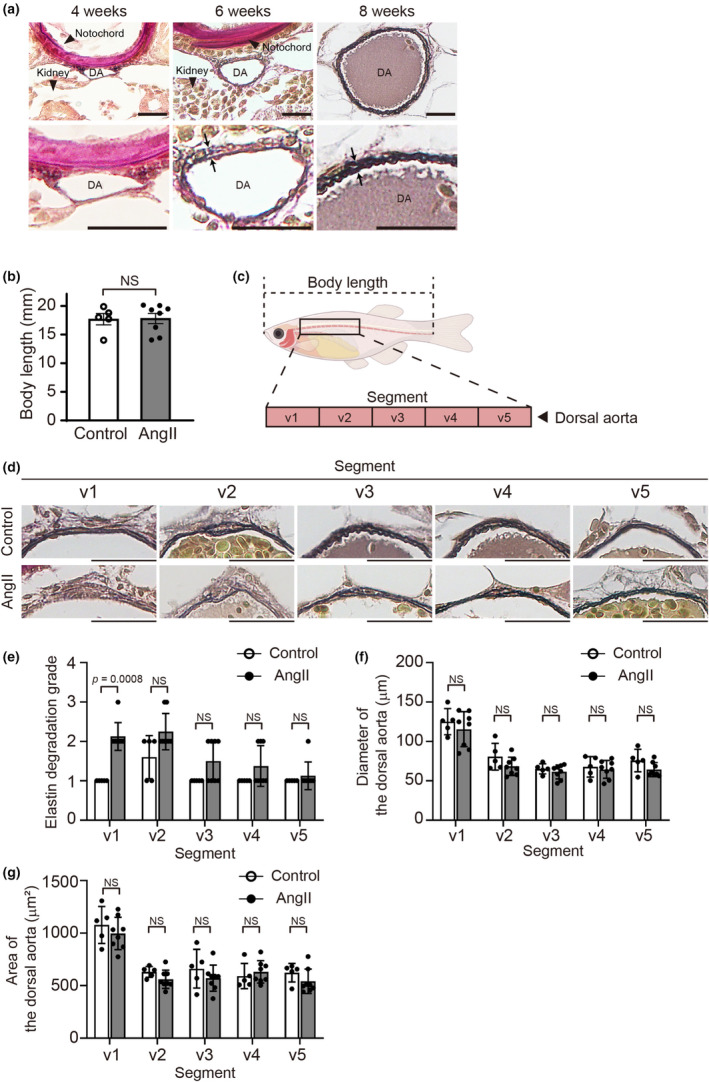
 Tg(kdrl:EGFP) zebrafish at 4, 6, and 8 weeks post‐fertilization (wpf) (The experiment with adult zebrafish included seven zebrafish: Two females and one male at 6 wpf, and two females and two males at 8 wpf. n = 2, 3 (two females and one male), and 4 (two females and two males), respectively). Lower panels indicate higher magnification views of the dorsal aorta in the upper panels. 2 to 3 elastic lamellae were seen at 8 wpf (showed by arrows). DA, dorsal aorta. Scale bars: 20 μm. (b) Body length, length from the tip of the snout to the base of the tail, of control and 160 ng AngII‐injected Tg(kdrl:EGFP) zebrafish at 8 wpf. n = 5 (control) and 8 (160 ng AngII‐injected zebrafish). NS indicates not significant. (c) The illustration indicates the dorsal aorta region, that is, segments v1 through v5, for quantitative analyses. (d) Representative Elastica van Gieson–stained transverse images of the dorsal aorta segments v1 to v5 at 8 wpf. Scale bars: 20 μm. (e–g) Quantification of elastin grading, aorta diameter, and area of the segments v1 to v5 in (d). n = 5 (control) and 8 (160 ng AngII‐injected zebrafish). NS indicates not significant.

Acknowledgments
This image is the copyrighted work of the attributed author or publisher, and ZFIN has permission only to display this image to its users. Additional permissions should be obtained from the applicable author or publisher of the image. Full text @ Physiol. Rep.