IMAGE

Fig. 2.

ID
ZDB-IMAGE-250219-48
Source
Figures for Gjorcheska et al., 2025
Image
Figure Caption

Fig. 2.

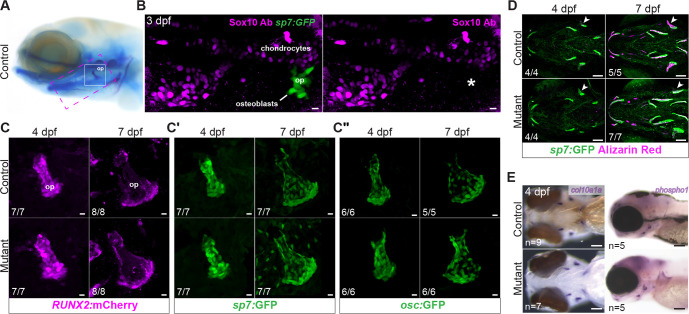
Normal patterns of growth and differentiation in sox10 mutant osteoblasts. (A) Reference image of a larva stained with Alcian Blue and Alizarin Red, with locations of the skeletal elements shown in B (magenta dashed box) and C (white box) highlighted. (B) Immunostaining with an anti-Sox10 antibody reveals strong expression in chondrocytes but a lack of Sox10 protein (asterisk) in mineralizing osteoblasts (sp7:GFP+) forming the op bone at 3 dpf. (C-C″) Example images from sequential live imaging showing normal patterns of RUNX2:mCherry, sp7:GFP and osc:GFP transgene expression in mutant osteoblasts of the op at 4 and 7 dpf. (D) Normal growth of sox10 mutant op (arrowheads) as well as other bones despite minimal calcium accumulation, revealed by live imaging of Alizarin Red-stained sp7:GFP+ embryos at 4 and 7 dpf. (E) Colorimetric in situ hybridizations for col10a1a and phospho1, encoding key bone matrix components, revealed no overt abnormalities in sox10 mutants at 4 dpf. op, opercle. Numbers in panels indicate the proportion of larvae of that genotype with the presented phenotype. Scale bars: 10 µm (B-C″); 100 µm (D,E).

Figure Data
Acknowledgments
This image is the copyrighted work of the attributed author or publisher, and ZFIN has permission only to display this image to its users. Additional permissions should be obtained from the applicable author or publisher of the image. Full text @ Development