IMAGE

Figure 4

ID
ZDB-IMAGE-250127-194
Source
Figures for Ren et al., 2024
Image
Figure Caption

Figure 4

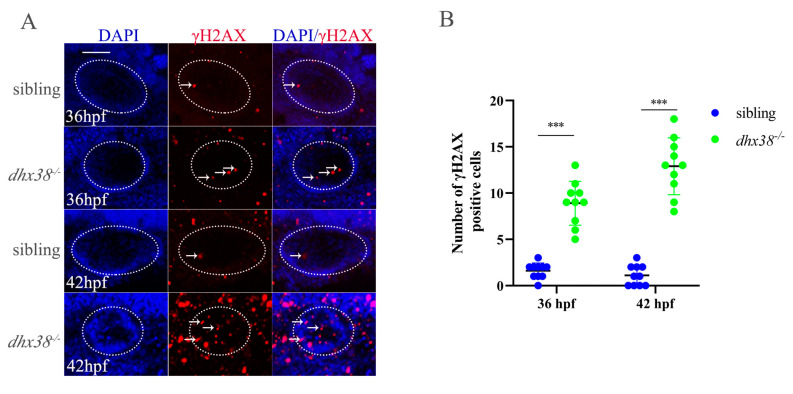
Analysis of the accumulation of DNA damage in inner ears of dhx38/ mutants: (A) Whole-mount immunofluorescence analysis using the anti-γH2AX antibody in inner ear regions of siblings and dhx38/ at 36 hpf and 42 hpf. The white arrows indicate the signal spots. n = 10 for each panel. Scale bar: 50 µm. (B) Quantitative analysis of the γH2AX-positive cells exhibited in the inner ear (the white, dotted, oval area) region in (A). The data are presented as the mean ± SD. ***, p < 0.001.

Figure Data
Acknowledgments
This image is the copyrighted work of the attributed author or publisher, and ZFIN has permission only to display this image to its users. Additional permissions should be obtained from the applicable author or publisher of the image. Full text @ Biomedicines