
|
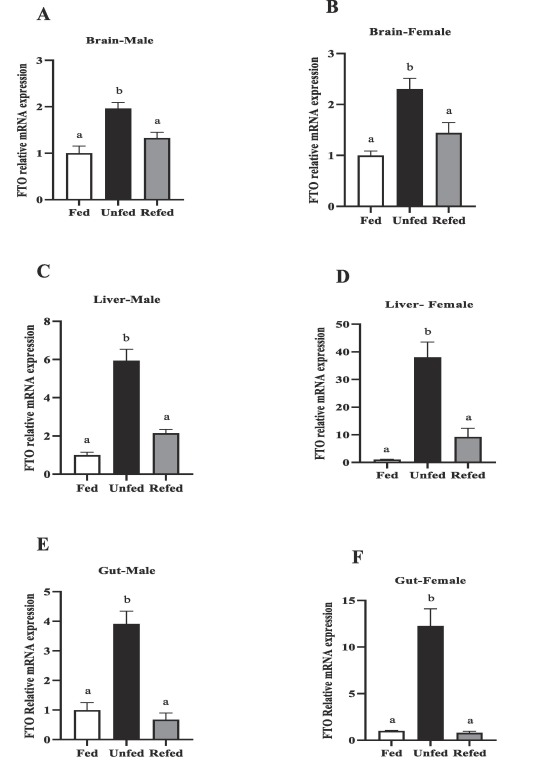
Fig. 9 FTO mRNA abundance in the metabolic tissues of male and female zebrafish during 7-day food deprivation and 24 h post-feeding (refed group). Brain (A–B), liver (C–D( and gut (E,F). FTO mRNA expression was normalized to β-actin and 18S. Different letters above bars indicate significant differences between groups (one-way ANOVA followed by Student-Newman-Keul’s post-hoc test, P < 0.05). Asterisks represent significant differences among the groups at the same time point (Student’s t-test; (*p < 0.05, **p < 0.01, ***p < 0.001 ****p < 0.0001). Data are expressed as mean ± SEM (n = 6 zebrafish/group).