
Image
|
Figure Caption
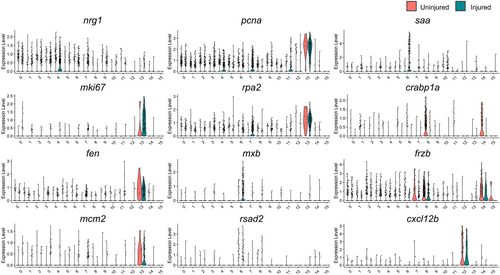
Fig. 5 Epicardial gene expression in tcf21+ Epi/EPDCs of uninjured and regenerating hearts. Violin plot comparing the expression of nrg1, mki67, fen1, mcm2, PCNA, rpa2, mxb, rsad2, saa, crabp1a, Frzb, and cxcl12b to label distinct subpopulations of tcf21+
Acknowledgments
This image is the copyrighted work of the attributed author or publisher, and
ZFIN has permission only to display this image to its users.
Additional permissions should be obtained from the applicable author or publisher of the image.
Full text @ Dev. Dyn.