IMAGE

Fig. 7.

ID
ZDB-IMAGE-240304-25
Source
Figures for Hewitt et al., 2024
Image
Figure Caption

Fig. 7.

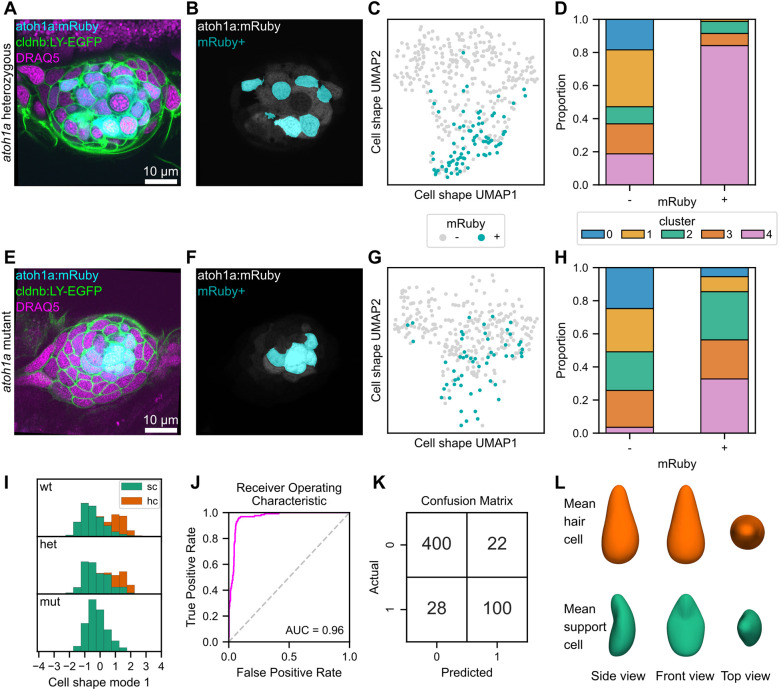
Shape characteristics of atoh1a:mRuby heterozygotes and mutants, and logistic classifier for hair cells based on cell shape features. (A-G) Analysis of cell shape distributions in atoh1a:mRuby heterozygotes (A-D) and mutants (E-H). (A,E) Single confocal slice of a neuromast from an atoh1a:mRuby heterozygote (A) and mutant (E) also expressing Tg(-8.0cldnb:LY-EGFP) and stained with DRAQ5. Image contrast was adjusted for visibility. (B,F) The same slices as in A and E, with the atoh1a:mRuby channel (gray) overlaid with a mask indicating cells classified as mRuby+ (cyan) for a atoh1a:mRuby heterozygote (B) and mutant (F). (C,G) UMAP of mRuby+ (cyan) and mRuby (gray) cells from atoh1a:mRuby heterozygotes (C) and mutants (F). (D,H) Proportions of mRuby cells (left bar) and mRuby+ cells (right bar) from atoh1a:mRuby heterozygotes (D) and mutants (H) in each cell shape cluster. (I) Distributions of cell shape mode 1 scores, separated by genotype (top row, wild type; middle row, atoh1a heterozygous; bottom row, atoh1a mutant). Hair cells (hc, green); support cells (sc, orange). (J) Receiver operating characteristic (ROC) curve (fuchsia) for a logistic regression classifier trained to detect hair cells based on cell shape mode 1-8. The area under the curve (AUC) score is shown (0.96). Gray dashed line, performance of a random classifier. (K) Confusion matrix for the cell shape-based hair cell classifier. 0, support cells; 1, hair cells. Top left, true negatives; top right, false positives; bottom left, false negatives; bottom right, true positives. (L) The idealized mean cell shape for hair cells (top, orange) and support cells (bottom, green).

Acknowledgments
This image is the copyrighted work of the attributed author or publisher, and ZFIN has permission only to display this image to its users. Additional permissions should be obtained from the applicable author or publisher of the image. Full text @ Development