IMAGE

Fig. 2.

ID
ZDB-IMAGE-240304-21
Source
Figures for Hewitt et al., 2024
Image
Figure Caption

Fig. 2.

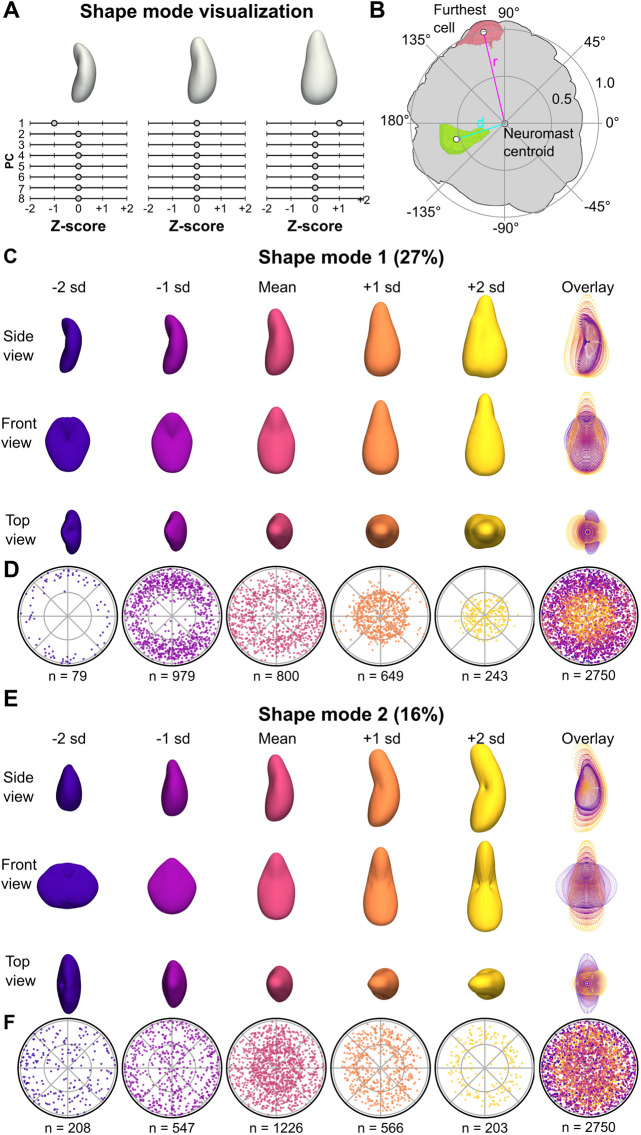
Visualization of cell shape modes 1 and 2. (A) Schematic depicting how shape variation was visualized. PCs were first z-scored to generate shape modes. Visual representations of each shape mode were generated by finding the mean cell (a hypothetical cell with a value of 0 for all 8 shape modes) and varying one shape mode (here, shape mode 1) by up to 2 standard deviations (s.d.) while holding other shape modes at the mean (0). (B) Schematic depicting how relative cell locations within each neuromast were calculated. The distance between the neuromast centroid and the furthest cell (r) in the xy plane was calculated. The distances between the neuromast centroid and cell centroids were divided by (r) to yield the normalized distance from the neuromast center (d). The angular location of each cell was determined in reference to the positive x-axis centered on the neuromast centroid. Cell locations were projected onto a unit circle with radius 1. (C) Visualization of CSM1, generated as described in A. 3D surface renderings are shown from three different views, as well as an overlay of point representations for each view (rightmost column). (D) Polar plots of relative cell locations (generated as shown in B) binned by CSM1 scores. Bins were centered on the corresponding z-score and included cells with values within 0.5. For the −2 s.d. and 2 s.d. plots, the upper bounds were not limited to within 0.5 (e.g. the first plot includes all cells with CSM1 values less than −1.5 s.d.). An overlay of the first five plots is shown in the rightmost column. (E) Visualization of CSM2. 3D surface renderings are shown from three different views, as well as an overlay of point representations for each view (rightmost column). (F) Polar plots of relative cell locations binned by CSM2 scores. An overlay of the first five plots is shown in the rightmost column.

Acknowledgments
This image is the copyrighted work of the attributed author or publisher, and ZFIN has permission only to display this image to its users. Additional permissions should be obtained from the applicable author or publisher of the image. Full text @ Development