IMAGE

Figure 2

ID
ZDB-IMAGE-240226-88
Source
Figures for Hagen et al., 2024
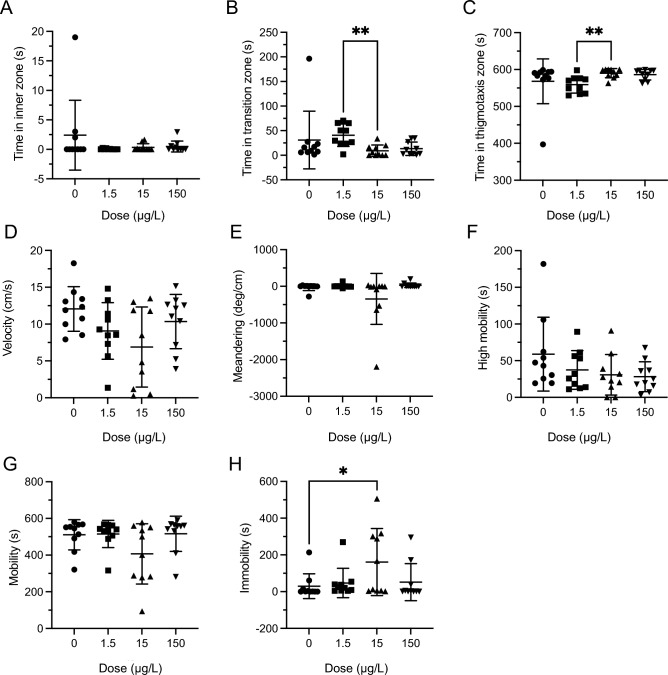
Image
Figure Caption

Figure 2

Acute LSD effect in the novel object approach (NOA) test. (A) Time spent in inner zone was not significantly different during acute dose NOA testing. (B) Time in transition zone was significantly different between groups during acute dose NOA testing. The ** represents a significant difference of P < 0.01. (C). Time spent in thigmotaxis was significantly different between groups during acute dose NOA testing. The ** represents a significant difference of P < 0.01. (D) Velocity was not significantly different during acute dose NOA testing. (E) Meandering was significantly different during acute dose NOA testing, but there were no post-hoc differences. (F) High mobility was not significantly different during NOA acute dose testing. (G) Mobility was not significantly different during the acute dose NOA testing. (H) Immobility was not significantly different during NOA acute dose testing with a difference between 0 µg/L and 15 µg/L. The * represent a significant difference of P < 0.05. Sample sizes for A-H: 0 (n = 10), 1.5 (n = 10), 15 (n = 10), 150 (n = 10). Data presented as mean + /- SD.

Acknowledgments
This image is the copyrighted work of the attributed author or publisher, and ZFIN has permission only to display this image to its users. Additional permissions should be obtained from the applicable author or publisher of the image. Full text @ Sci. Rep.