IMAGE

Figure 1.

ID
ZDB-IMAGE-240221-28
Source
Figures for Andersson et al., 2024
Image
Figure Caption

Figure 1.

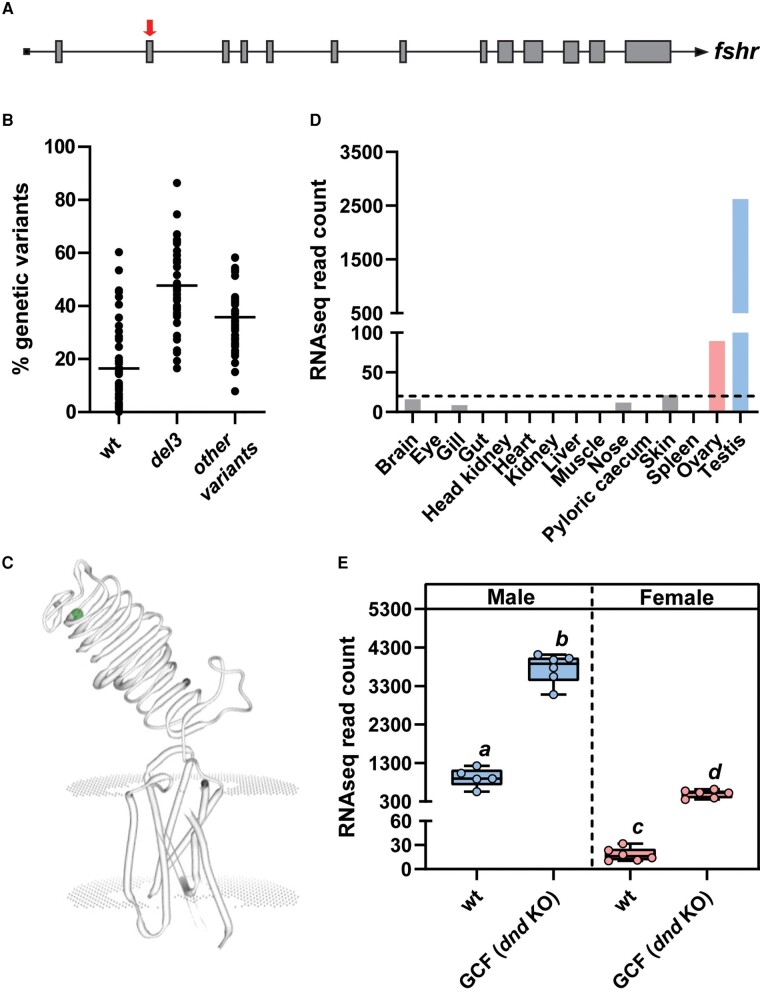
Fshr gene exon 2 target site (A; red arrow), The distribution of fshr variants in fin clips obtained from 40 fshr crispant males (B), dots representing prevalence of variant types found in single fish and the horizontal line the average percentage of each fshr variant groups which includes the wt fshr variant, deletion 3 (del3) variant and other fshr variants (mainly frameshift) deviating from wt fshr. In the SWISS-MODEL illustration of the Fshr protein (C), the CRISPR target site is indicated by the green dot. (D) fshr expression levels in juvenile tissues used for generating the reference annotation of the Atlantic salmon genome (GenBank GBRB00000000.1). Results are expressed as RNA sequencing (RNA-seq) normalized read counts (n = 1). Dashed line indicates 20 RNAseq reads. (E) Gonadal fshr expression in adult wild-type (wt) and germ cell–free (GCF) dead end (dnd) knockout salmon males and females. Data are shown as mean RNA-seq normalized read counts ± SEM (n = 5-6; different letters denote statistically significant differences).

Acknowledgments
This image is the copyrighted work of the attributed author or publisher, and ZFIN has permission only to display this image to its users. Additional permissions should be obtained from the applicable author or publisher of the image. Full text @ Endocrinology