
IMAGE
Fig. 5
- ID
- ZDB-IMAGE-240215-28
- Publication
- Sundaramurthi et al., 2023 - Ergolide mediates anti-cancer effects on metastatic uveal melanoma cells and modulates their cellular and extracellular vesicle proteomes
- All Figures
- Figures for Sundaramurthi et al., 2023
Image
|
Figure Caption
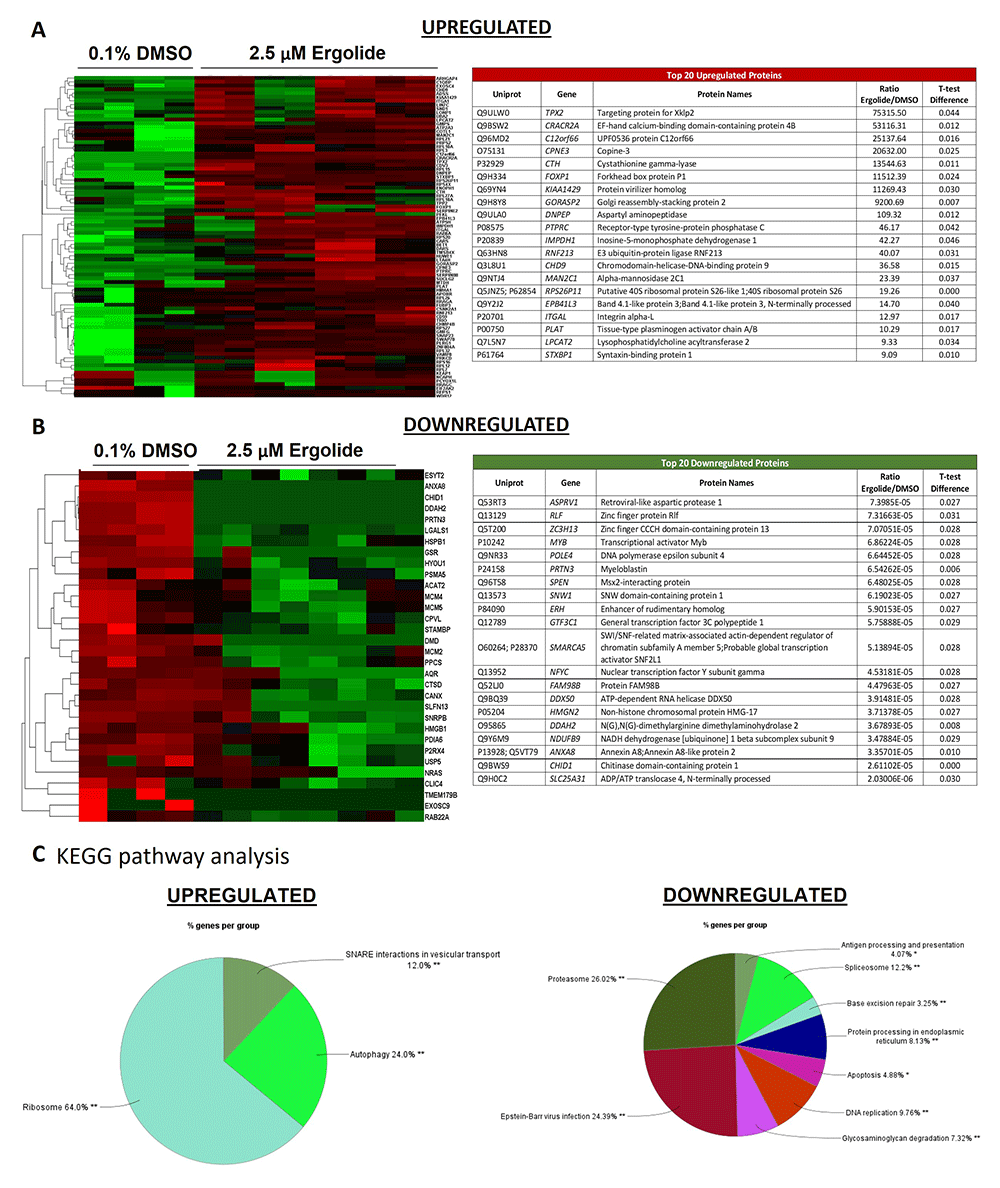
Fig. 5 Analysis of differentially expressed proteins in EVs isolated from OMM2.5 cells treated with ergolide. (A) Heatmap of upregulated proteins in ergolide treatment group (left panel); list of top 20 significantly upregulated proteins in samples treated with ergolide (right panel). (B) Heatmap of downregulated proteins in ergolide treatment group (left panel); list of top 20 significantly downregulated proteins in samples treated with ergolide (right panel). (C) KEGG pathway analysis to determine pathways enriched in EVs following ergolide treatment.
Acknowledgments
This image is the copyrighted work of the attributed author or publisher, and
ZFIN has permission only to display this image to its users.
Additional permissions should be obtained from the applicable author or publisher of the image.
Full text @ Open Res Eur