IMAGE

Figure 3.

ID
ZDB-IMAGE-240111-28
Source
Figures for Heins-Marroquin et al., 2024
Image
Figure Caption

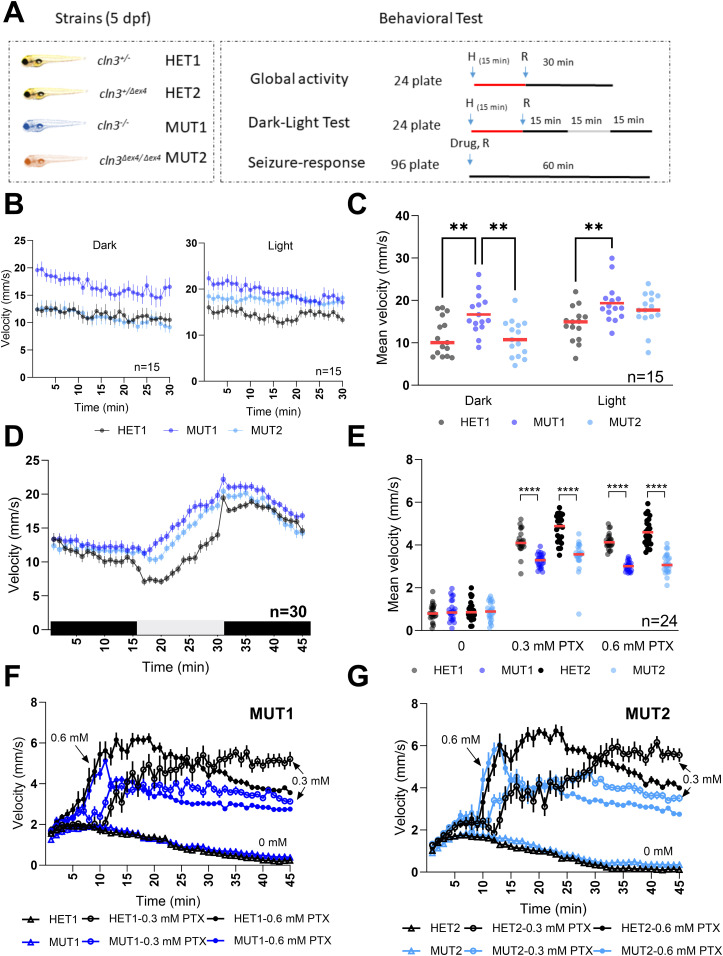
Figure 3. Locomotor behavior of cln3 mutant larvae under different light conditions.

(A) Experimental design of behavioral response studies for 5 dpf larvae. For the global activity and dark–light response assays, 8 larvae/line were placed in a 24-well plate (1 larva/well) and pre-adapted for 15 min to the indicated condition (light/dark) before starting the recording. The movement was tracked for 45 min in 15-min light/dark intervals or for 30 min under one continuous lightning condition. For the seizure response assay, 12 larvae/line were placed in a 96-well plate and recording was started shortly after addition of PTX for 1 h. Vehicle control was 0.6% DMSO. (B) Mean velocity (1-min intervals) of the larvae recorded under constant lighting conditions (n = 15 for each line). (B, C) Total mean velocity recorded in panel (B). (D) Mean velocity (1-min intervals) of the larvae in alternating lighting conditions (n = 30 for each line). (E) Total mean velocity in 1-h exposure to 0, 0.3, and 0.6 mM PTX. (E, F, G) Behavioral profiles (1-min intervals) of the larvae recorded in panel (E) (n = 24 for each line). All experiments shown are representative of at least three independent experiments performed on different days. In all the behavioral profiles shown, data points are means ± SEMs. In the scatter dot plots, each dot represents the total mean velocity of one larva and the red line represents the median. Statistically significant differences between lines were determined using the ordinary two-way ANOVA test followed by Sidak’s multiple comparison test (**P ≤ 0.0021 and ****P ≤ 0.0001).

Acknowledgments
This image is the copyrighted work of the attributed author or publisher, and ZFIN has permission only to display this image to its users. Additional permissions should be obtained from the applicable author or publisher of the image. Full text @ Life Sci Alliance