IMAGE

Figure S7.

ID
ZDB-IMAGE-240111-22
Source
Figures for Heins-Marroquin et al., 2024
Image
Figure Caption

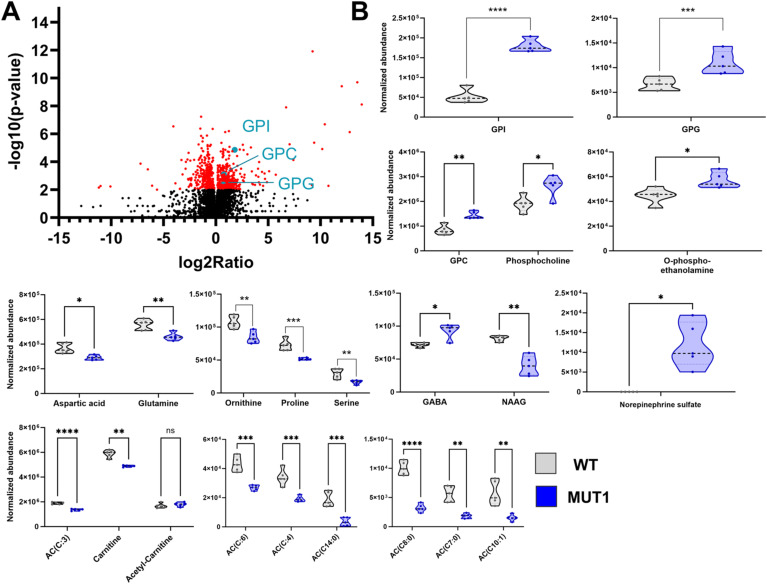
Figure S7. Most significantly altered metabolite classes between wild-type and MUT1 larvae (experiment 2).

(A) Volcano plot (P-value versus fold change ratio) showing significantly (P < 0.001) altered metabolites in red. Each dot represents one metabolite. GPD species are highlighted in turquoise. (B) Violin plots showing normalized abundance values for the indicated metabolite values. Statistically significant differences between the two zebrafish lines were determined using an unpaired multiple Welch’s t test (*P ≤ 0.05; **P ≤ 0.01; ***P ≤ 0.001; and ****P < 0.0001).

Acknowledgments
This image is the copyrighted work of the attributed author or publisher, and ZFIN has permission only to display this image to its users. Additional permissions should be obtained from the applicable author or publisher of the image. Full text @ Life Sci Alliance