
Image
|
Figure Caption
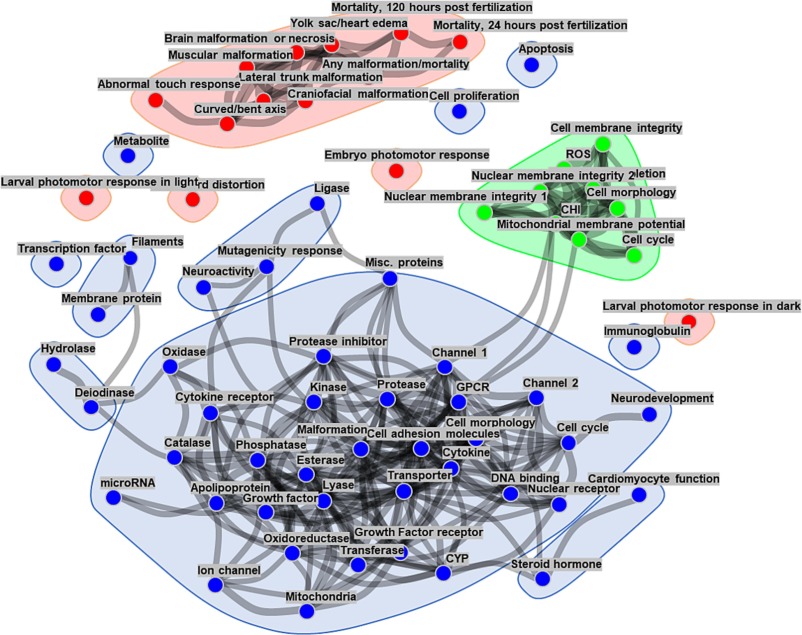
Fig. 4 Correlation network representation of assay endpoints from CHS, ZBEscreen™, and the EPA's CompTOX dashboard. Correlation analyses and clustering of the network vertices showed the formation of distinct groups of assay endpoints. Blue points are assay endpoints curated within CompTOX, red and green points represent endpoint readouts from the ZBEscreen™ and CHS, respectively. The edges indicating correlations with absolute value <0.5 are not shown. (For interpretation of the references to colour in this figure legend, the reader is referred to the web version of this article.)
Acknowledgments
This image is the copyrighted work of the attributed author or publisher, and
ZFIN has permission only to display this image to its users.
Additional permissions should be obtained from the applicable author or publisher of the image.
Full text @ Tox. App. Pharmacol.