
|
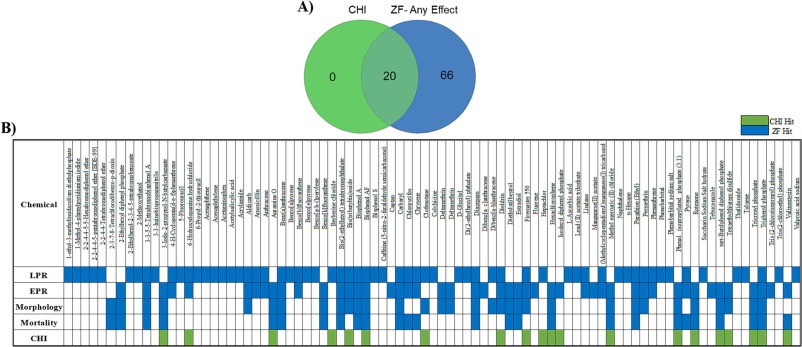
Fig. 2 Concordance between the SYSTEMETRIC® Cell Health Screen and ZBEscreen™. A) Venn diagram showing the number of bioactive chemicals between the ZBEscreen™ and SYSTEMETRIC® CHS B) Distribution of CHI™ bioactives and ZBEscreen™ endpoints across the 87 DNT chemical library where the zebrafish endpoints were separated by mortality, morphology, and the behavioral assessments EPR and LPR (green indicates bioactivity identified by CHI, blue indicates bioactivity identified by any of the 4 zebrafish readouts). Likewise, DNT chemicals not identified through the CHI™ classification were detected by the ZBEscreen™, demonstrating the complementarity between the systems used in tandem. (For interpretation of the references to colour in this figure legend, the reader is referred to the web version of this article.)