
|
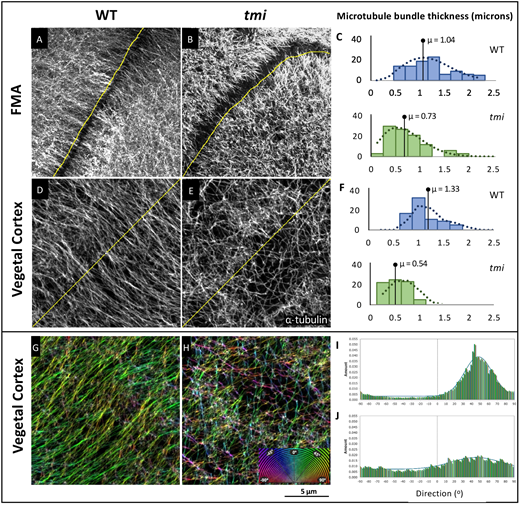
Fig. 9 Prc1l functions in microtubule bundling and orientation. (A-C) FMA microtubules. (A) In wild type during furrow formation, microtubules coalesce in thick bundles along the FMA. (B) Microtubules along the FMA in tmi mutant embryos exhibit lack of bundling. (C) Quantification of the average width of the microtubules and microtubule bundles along the FMA in wild-type (blue, n=30) and mutant (green, n=30) embryos at the four-cell stage (56-63 mpf). (D-F) Vegetal cortex microtubules. (D) Microtubule bundles at the vegetal cortex of wild-type embryos. (E) Microtubules at the vegetal cortex of tmi mutant embryos show reduced bundling. (F) Quantification of the average width of vegetal cortex microtubules and microtubule bundles in wild type (blue, n=30) and mutants (green, n=30) at 20 mpf, showing decreased thickness in mutants. Statistical analysis in C,F was carried out using the Mann–Whitney test. (G-J) Microtubule track directionality analysis of vegetal cortex microtubules (RGB 180° spectral color coding). Microtubule tracks exhibit a cohesive orientation in wild type (single-color coding in G, n=6), and a disorientated network in tmi embryos (multi-color coding in H, n=6). Microtubule track angle distribution at 20 mpf (shown in I,J for representative single ROIs) shows regularity in wild type (I) but not mutants (J). The difference between distributions is statistically significant according to a Kolmogorov–Smirnov test (P<0.009).