IMAGE

Fig 7

ID
ZDB-IMAGE-231215-227
Source
Figures for Maung Ye et al., 2023
Image
Figure Caption

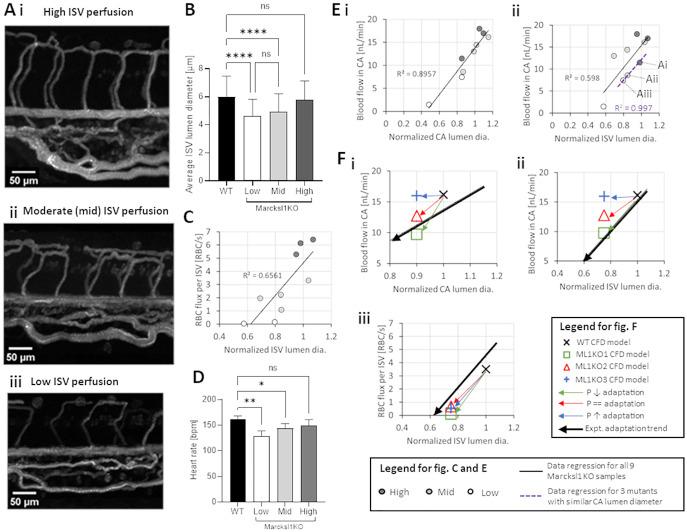
Fig 7 Characterization of RBC flow in Marcksl1 KO zebrafish with reduced vessel diameters.

(A) Representative maximum intensity time-stack projection images of RBC flow in the ISV networks of 2 dpf Marcksl1 KO zebrafish, from high (i), moderate/mid (ii) to low (iii) perfusion. (B) Comparison of average ISV lumen diameters of Marcksl1 KO zebrafish in different perfusion level groups versus WT. (C) RBC flux reduction in ISVs in response to ISV lumen diameter reduction (in Marcksl1 KO zebrafish). (D) Comparison of heart rate in Marcksl1 KO zebrafish versus WT. Statistical comparisons in B and D were performed using one-way ANOVA with Sidak’s multiple pair comparisons. *, p < 0.05; **, p < 0.01; ****, p < 0.0001. (E) Experimental observations of flow reductions in Marcksl1 KO mutants. Arterial blood flow reduction in CA in response to reduced CA lumen diameters (i). Arterial blood flow reduction in CA in response to reduced ISV lumen diameters (ii). Purple dashed lines indicate data points from the same embryos in Ai to Aiii, which have similar CA lumen diameter. (F) Comparison between the modeled adaptation scenarios (green, red and blue arrows) compared to experimentally observed adaptation trends (black arrow: regression data from E) for CA blood flow against CA diameter (i), CA blood flow against ISV lumen diameter (ii) and RBC flux entering ISVs against ISV lumen diameter (iii).

Acknowledgments
This image is the copyrighted work of the attributed author or publisher, and ZFIN has permission only to display this image to its users. Additional permissions should be obtained from the applicable author or publisher of the image. Full text @ PLoS Comput. Biol.