IMAGE

Fig 3

ID
ZDB-IMAGE-231215-224
Source
Figures for Maung Ye et al., 2023
Image
Figure Caption

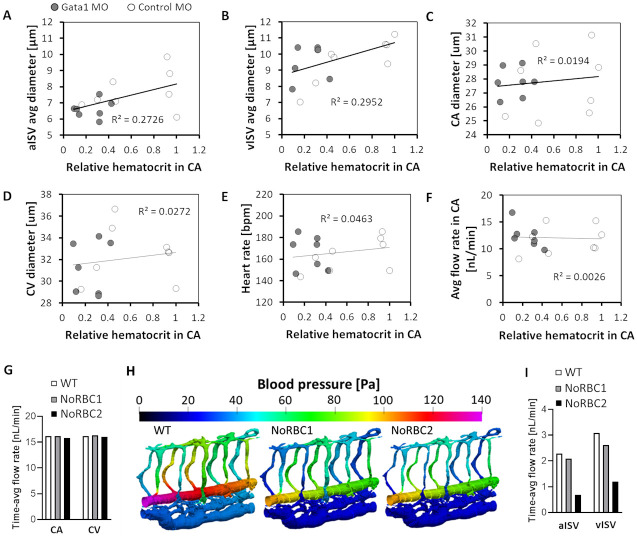
Fig 3 Systemic alteration in vessel morphology and blood flow in zebrafish with reduced RBC hematocrit.

(A to D) Diameters of aISV: p = 0.046 (A), vISV: p = 0.036 (B), CA: p = 0.63 (C) and CV: p = 0.56 (D) as functions of the relative CA hematocrit in gata1 and control morphants. (E to F) Heart rate: p = 0.44 (E) and estimated flow rate: p = 0.86 (F) as functions of the relative CA hematocrit. Statistical significances of slopes in A to F were determined using regression t-test. (G) CFD model predictions of blood flow rates in CA (16.15, 16.15, 15.76 nL/min) and CV (16.21, 16.34, 16.06 nL/min) for WT (14% Ht), NoRBC1 (0% Ht) and NoRBC2 (0% Ht and 18% ISV diameter reduction). (H) CFD predictions of systolic pressure distribution maps in models WT, NoRBC1 and NoRBC2. (I) CFD predicted blood flow rates in the aISVs (-9.1% and -70% for NoRBC1 and NoRBC2, respectively, compared to WT) and vISVs (-15% and -61% for NoRBC1 and NoRBC2, respectively, compared to WT).

Acknowledgments
This image is the copyrighted work of the attributed author or publisher, and ZFIN has permission only to display this image to its users. Additional permissions should be obtained from the applicable author or publisher of the image. Full text @ PLoS Comput. Biol.