IMAGE

Fig 2

ID
ZDB-IMAGE-231215-223
Source
Figures for Maung Ye et al., 2023
Image
Figure Caption

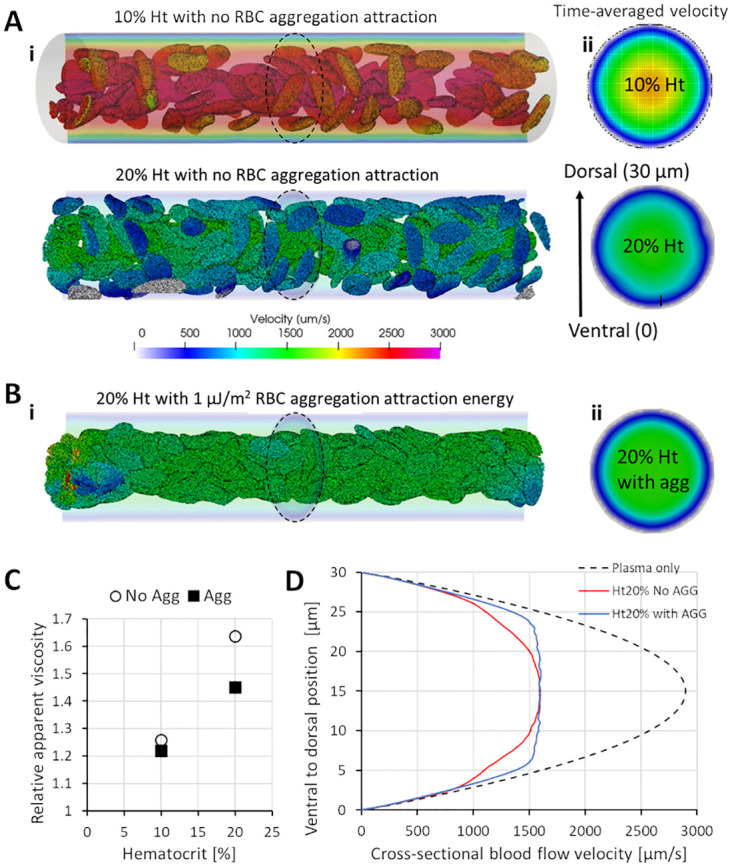
Fig 2 Effects of RBC hematocrit and aggregation on viscosity and blood flow velocity.

(A) Snapshots of RBC arrangement and velocity driven by steady state 9.6 Pa pressure drop from left to right ends of the vessel segment (30 μm in diameter and 150 μm in length) under 10 and 20% hematocrits (i) and the time-averaged blood velocity plot in the cross-sectional lumen at the middle of the vessel length (ii). (B) Snapshots of RBC rouleaux formation and velocity under 20% hematocrits and 1 μJ/m2 aggregation levels (i) and the time-averaged blood velocity plot in the cross-sectional lumen at the middle of the vessel length (ii). (C) Plot of relative apparent viscosity against hematocrit for blood with and without RBC aggregation. Movies of the four conditions simulated can be viewed in S3S5 Movies. (D) Flow retardation effect of RBCs in blood flow and the flow blunting effects of RBC aggregation on the cross-sectional velocity profile under constant segment pressure drop conditions.

Acknowledgments
This image is the copyrighted work of the attributed author or publisher, and ZFIN has permission only to display this image to its users. Additional permissions should be obtained from the applicable author or publisher of the image. Full text @ PLoS Comput. Biol.