IMAGE

Fig 4

ID
ZDB-IMAGE-231215-213
Source
Figures for Maung Ye et al., 2023
Image
Figure Caption

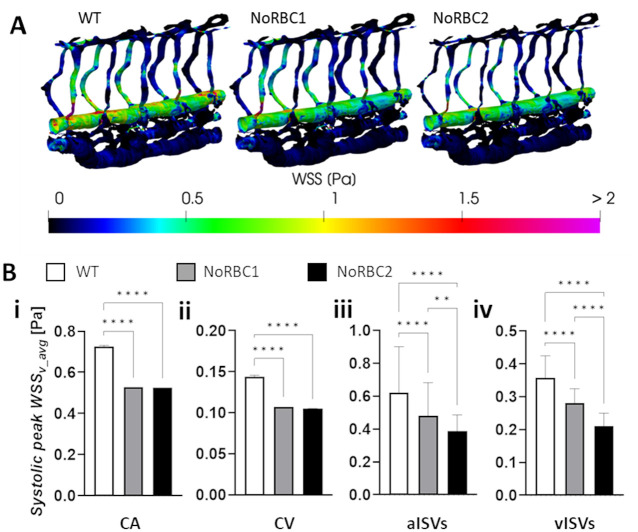
Fig 4 Decrease in ISV diameter exacerbates the decrease in WSS caused by hematocrit reduction.

(A) Systolic WSS distributions in models WT (14% Ht), NoRBC1 (0% Ht) and NoRBC2 (0% Ht and 18% ISV diameter reduction). (B) Predicted systolic WSS levels in the CA (i), CV (ii), aISVs (iii) and vISVs (iv) for the 3 models. Statistical comparisons were performed using one-way ANOVA with Sidak’s multiple pair comparisons. **, p < 0.01; ****, p < 0.0001.

Acknowledgments
This image is the copyrighted work of the attributed author or publisher, and ZFIN has permission only to display this image to its users. Additional permissions should be obtained from the applicable author or publisher of the image. Full text @ PLoS Comput. Biol.