IMAGE

Figure 2

ID
ZDB-IMAGE-231212-30
Source
Figures for Bernal-Bermúdez et al., 2023
Image
Figure Caption

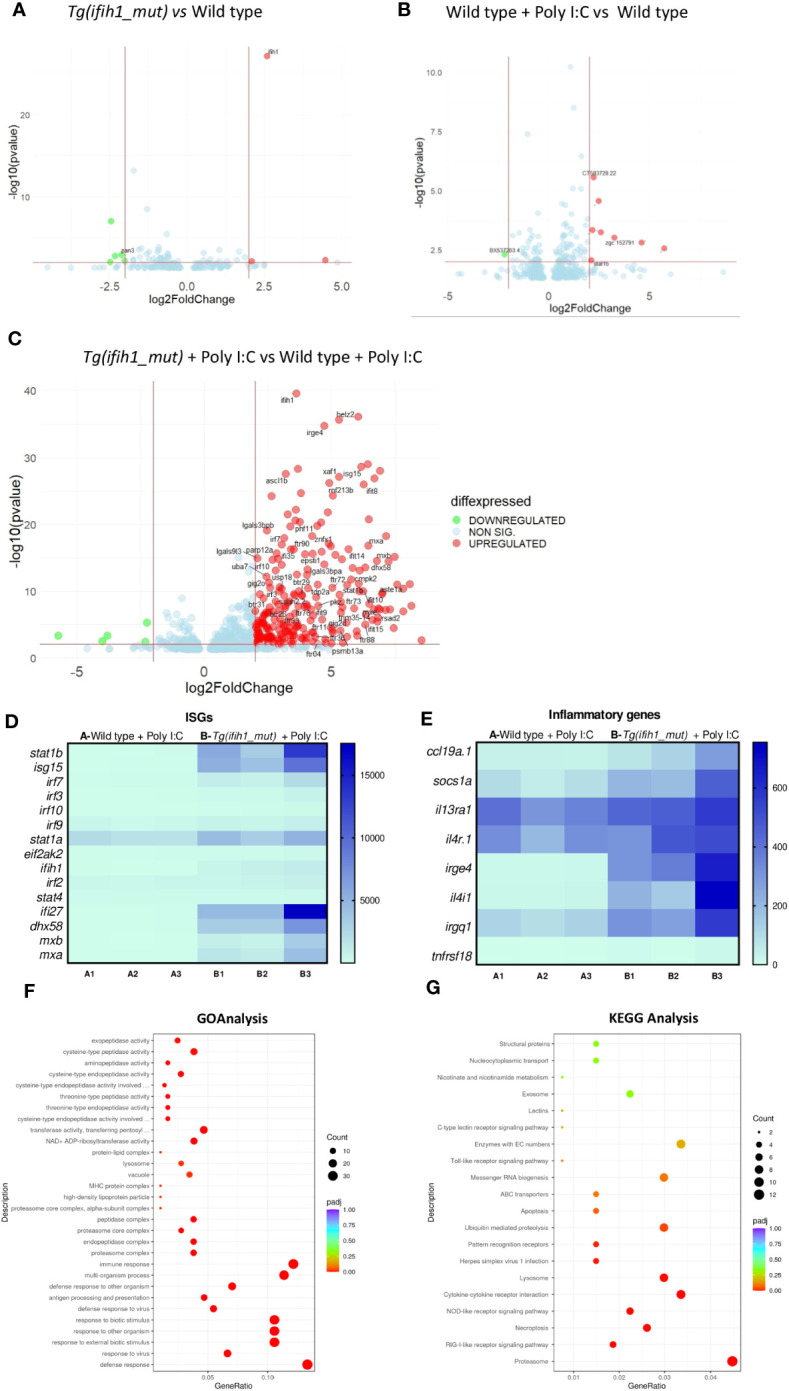
Figure 2

Transcriptomic analysis of the Tg(ifih1_mut) reveals systemic inflammation and an ISG signature upon poly I:C induction. Differentially expressed genes (DEGs) between wild-type larvae and Tg(ifih1_mut)(A), between wild type + Poly I:C and wild-type (B), and between Tg(ifih1_mut) + Poly I:C and wild type + Poly I:C (C). (D, E) Heatmap of analyzed ISGs (D) and proinflammatory genes (E) between Tg(ifih1_mut) + Poly I:C and wild type + Poly I:C represented by counts. (F, G) GO (F) and KEGG (G) analysis between Tg(ifih1_mut) + Poly I:C and wild type + Poly I:C.

Acknowledgments
This image is the copyrighted work of the attributed author or publisher, and ZFIN has permission only to display this image to its users. Additional permissions should be obtained from the applicable author or publisher of the image. Full text @ Front Immunol