IMAGE

Fig. 4.

ID
ZDB-IMAGE-231202-5
Source
Figures for Zlatanova et al., 2023
Image
Figure Caption

Fig. 4. 
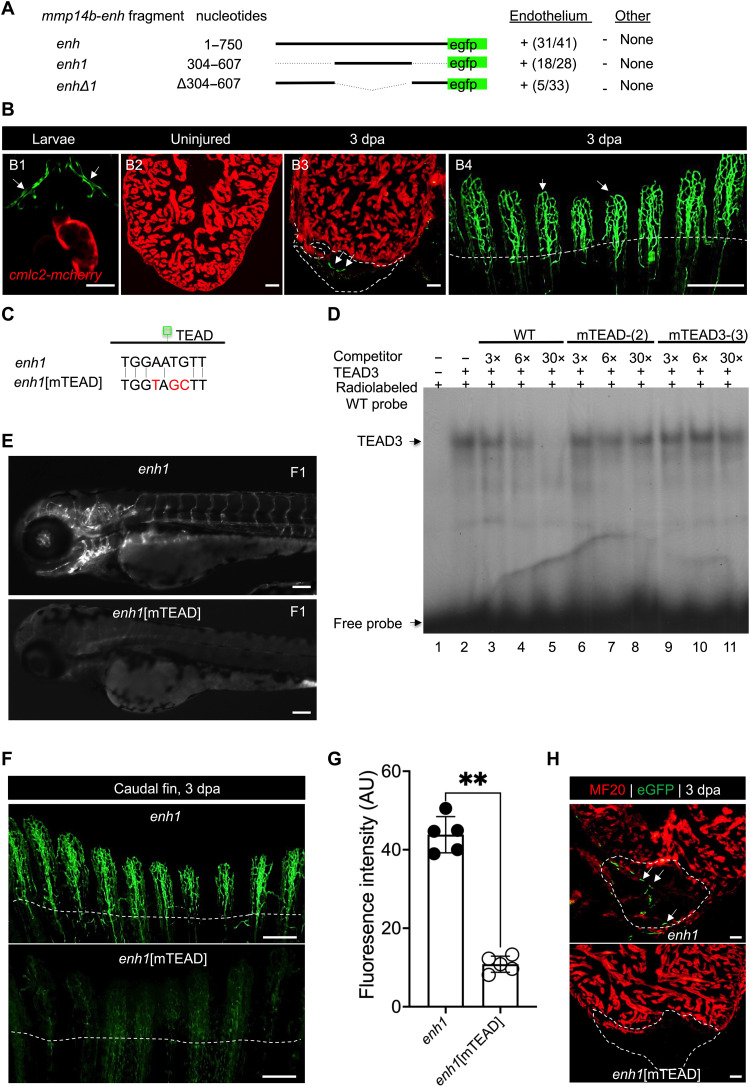
Identification of a TEAD motif–dependent core region of mmp14b-enh.

(A) mmp14b-enh-egfp deletion constructs and their activity in transgenic zebrafish larvae at 72 hpf. Activity in endothelial cells and nonendothelial cells (other) is summarized. Numbers represent the fraction of larvae that exhibited activity in the vasculature. (B) Representative fluorescent images of Tg(mmp14b-enh1:egfp) transgenic zebrafish (B1), uninjured (B2), injured adult hearts (B3), and injured adult caudal fin (B4). eGFP fluorescence (green) indicates activity of the transgene. Cardiomyocytes in [(B1) to (B3)] are marked by cmlc2:mCherry (red). (C) TEAD site sequences in the mmp14b-enh1 and mmp14b-enh1[mTEAD] transgenes. (D) EMSA with recombinant TEAD3 and a radiolabeled, double-stranded mmp14b-enh1 TEAD site oligonucleotide probe. TEAD3 binding was efficiently competed by unlabeled, self-probe (lanes 3 to 5), but not versions in which two (lanes 6 to 8) or three (lanes 9 to 11) nucleotides were mutated. Unprogrammed reticulocyte lysate control (lane 1). WT, wild type. (E) Representative images of F1 generation Tg(mmp14b-enh1:egfp) and Tg(mmp14b-enh1:egfp[mTEAD]) zebrafish embryos at 72 hpf. (F) Representative images of caudal fins from stable transgenic lines, Tg(mmp14b-enh1:egfp) and Tg(mmp14b-enh1:egfp[mTEAD]) at 3 dpa. eGFP fluorescence (green) indicates activity of the transgenes. (G) Quantification of eGFP fluorescence intensity in AU in caudal fins 3 dpa from Tg(mmp14b-enh1:egfp) (closed circles) and Tg(mmp14b-enh1:egfp[mTEAD]) (open circles) zebrafish. (H) Heart sections from stable transgenic lines, Tg(mmp14b-enh1:egfp) and Tg(mmp14b-enh1:egfp[mTEAD]) at 3 dpa stained with anti-myosin (MF20, red) and anti-eGFP (green) antibodies. Dashed lines mark the amputation planes. White arrows denote endothelial expression. Scale bars, 50 μm [(B1), (B2), (B3), and (H)], 100 μm [(B4) and (E)], and 400 μm (F). Statistical significance in (G) was determined using Student’s t test. **P < 0.01.

Acknowledgments
This image is the copyrighted work of the attributed author or publisher, and ZFIN has permission only to display this image to its users. Additional permissions should be obtained from the applicable author or publisher of the image. Full text @ Sci Adv