
|
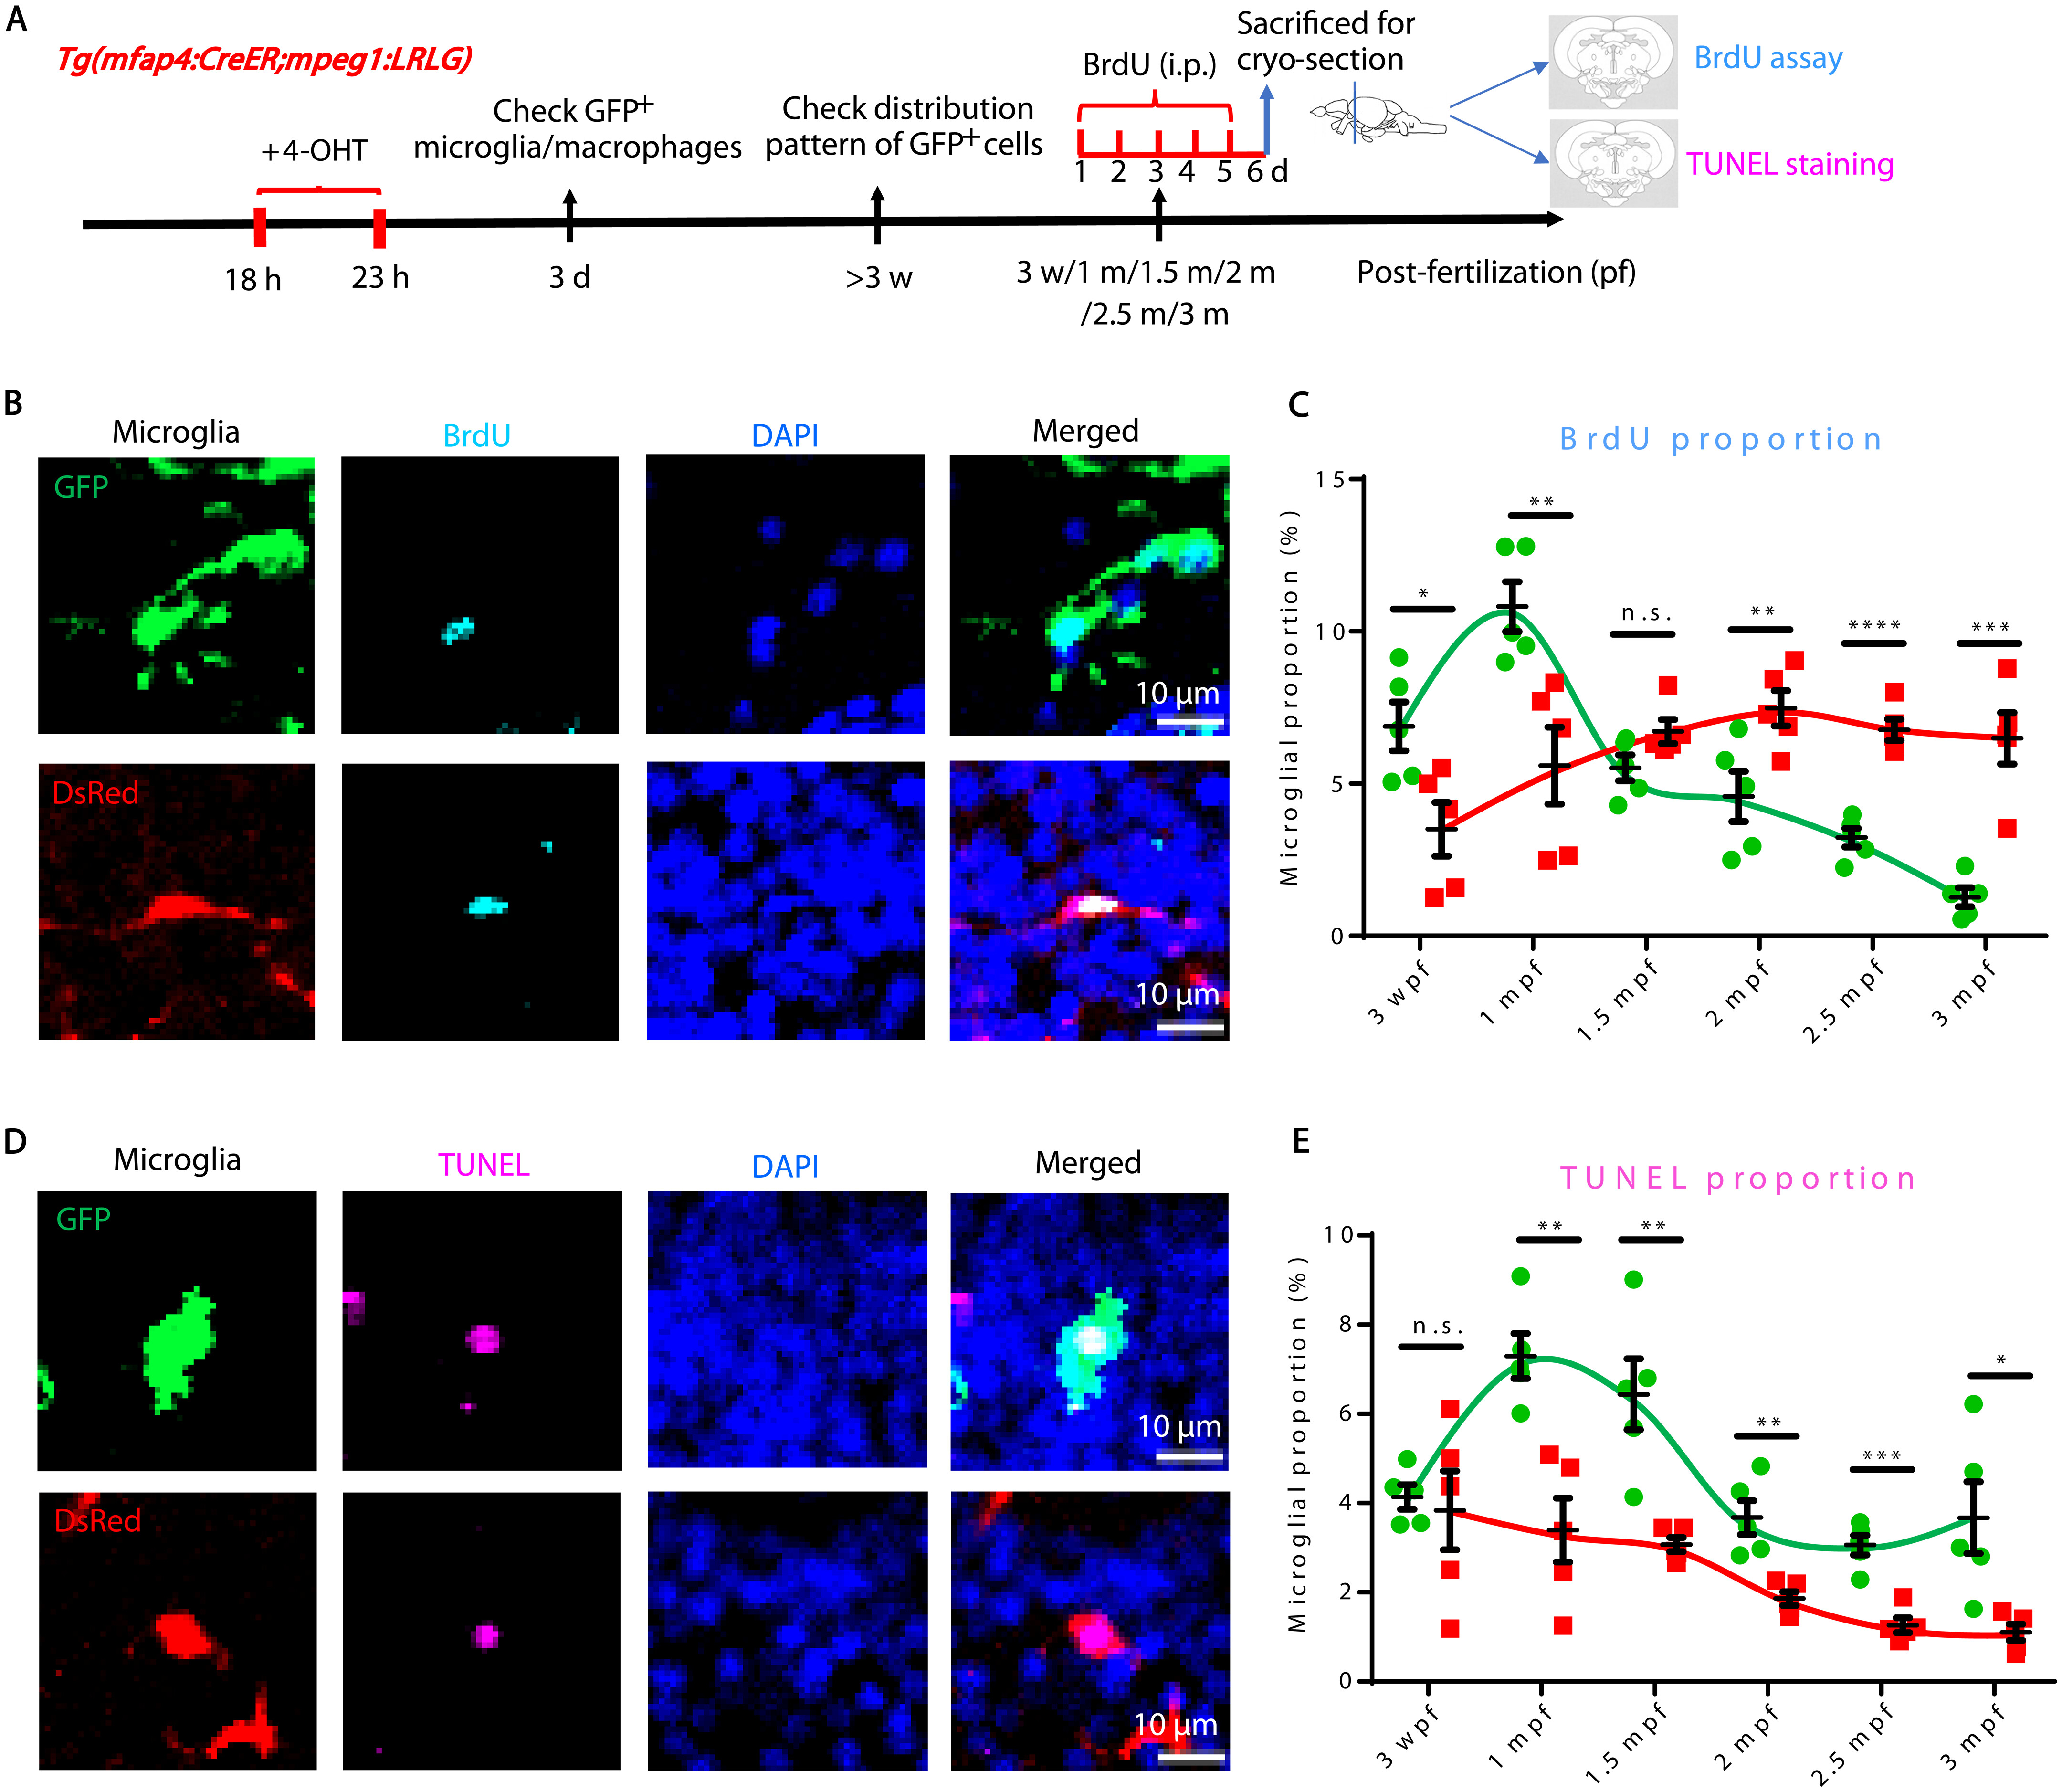
Fig. 2 BrdU and TUNEL assays reveal different proliferation and death rates of RBI and AGM microglia. (A) Schematic diagram shows the experimental setup for BrdU and TUNEL assays. (B) Representative images of GFP+ RBI microglia and GFP−DsRed+ AGM microglia costained with BrdU and DAPI. (C) Quantification of the proliferation rate of RBI (BrdU+GFP+/GFP+) and AGM (BrdU+GFP−DsRed+/GFP−DsRed+) microglia. (D) Representative images of GFP+ RBI microglia and GFP−DsRed+ AGM microglia costained with TUNEL and DAPI. (E) Quantification of the death rate of RBI (TUNEL+GFP+/GFP+) and AGM (TUNEL+GFP−DsRed+/GFP−DsRed+) microglia. not significant (n.s.), P > 0.05; *P < 0.05; **P < 0.01; ***P < 0.001; ****P < 0.0001 (Student’s t test). Data were presented as mean ± SEM (n = 5). i.p., intraperitoneal.