IMAGE

Figure 4.

ID
ZDB-IMAGE-231012-10
Source
Figures for Oyarbide et al., 2023
Image
Figure Caption

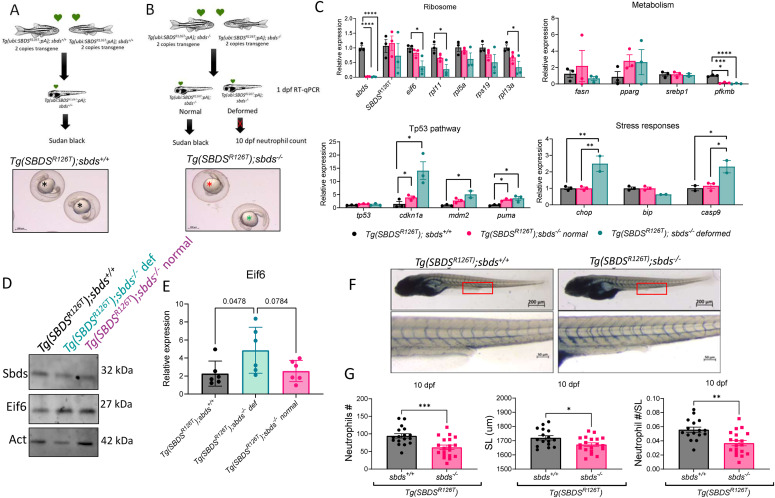
Figure 4. Level of SBDSR126T protein expression affected embryonic development.

(A) Incross between WT sbds fish with two copies of the transgenic line produced healthy embryos. (B) Incross between sbds KO fish with two copies of the transgenic line produced healthy embryos and deformed embryos. Black star shows healthy embryo, green star shows developmentally delayed, and red star shows deformed embryo. (C) qRT-PCR analysis of critical genes involved in ribosomal, metabolic, and tp53-associated pathways. (D) Western blot showing Eif6 accumulation in zebrafish-deformed embryos. (E) Protein quantification of Western blots as performed with NIH ImageJ. (F) Sudan black staining of 10 dpf larvae to count neutrophils. (G) Standard length and neutrophil number were reduced in sbds KO larvae expressing SBDSR126T.

Acknowledgments
This image is the copyrighted work of the attributed author or publisher, and ZFIN has permission only to display this image to its users. Additional permissions should be obtained from the applicable author or publisher of the image. Full text @ Life Sci Alliance