
Image
|
Figure Caption
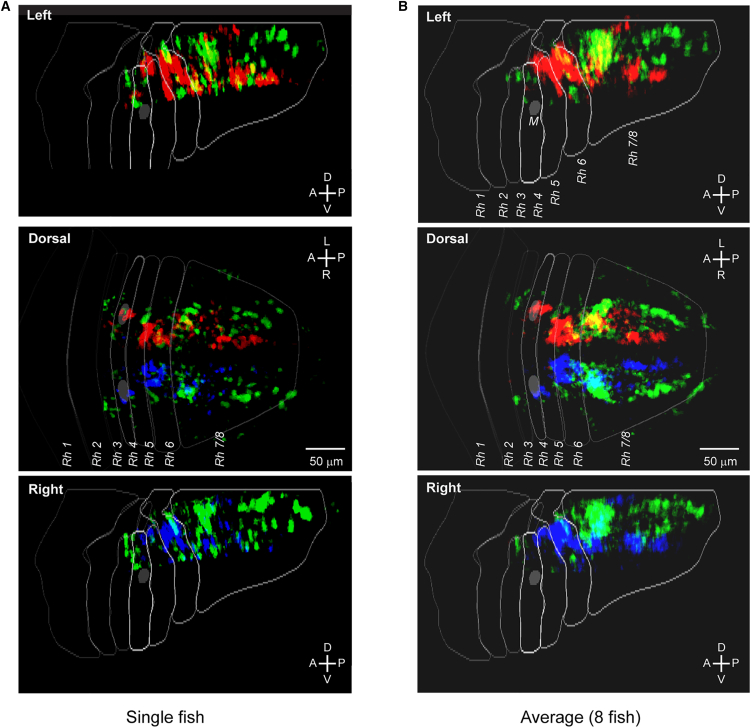
Figure 7
Anatomical distribution of ROIs belonging to the vergence and rotation clusters
(A) Spatial distribution of the ROIs assigned to the three clusters in the example fish (32,228 ROIs with EV > 0.4).
(B) Average distribution of the ROIs assigned to the three clusters (n = 8 fish). Individual maps (see
See also
Acknowledgments
This image is the copyrighted work of the attributed author or publisher, and
ZFIN has permission only to display this image to its users.
Additional permissions should be obtained from the applicable author or publisher of the image.
Full text @ Curr. Biol.