
|
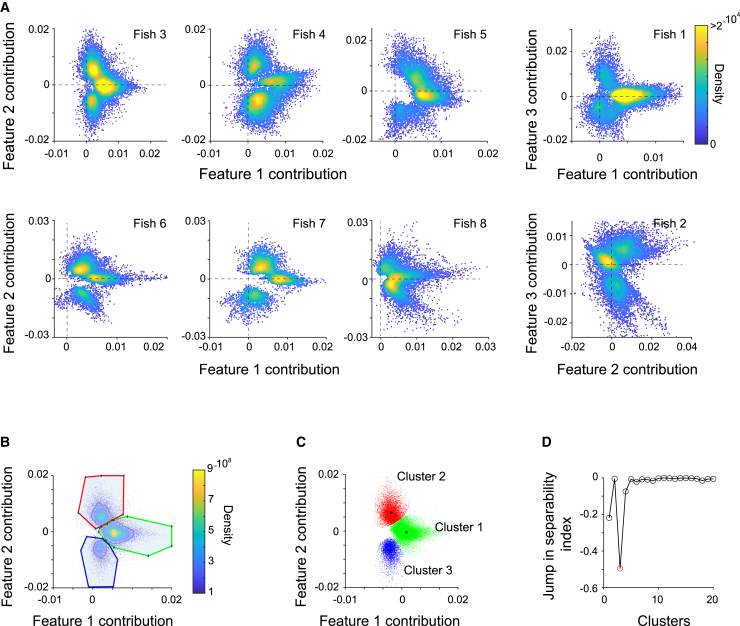
Figure 5
Equivalent ROI clusters are found across all imaged fish
(A) Contributions (U) to ROI activity of latent regressors associated with vergence and rotation features group into three clusters. Each dot corresponds to an ROI, each panel to a different fish. Only ROIs with EV > 0.4 are included.
(B) Manual assignment of ROIs to three clusters in feature contribution (U1-U2; see
(C) ROIs for the example fish are color-coded according to their cluster assignment (ROIs are subsampled here for better visualization). Black asterisks mark cluster centroids.
(D) Using ClusterDv