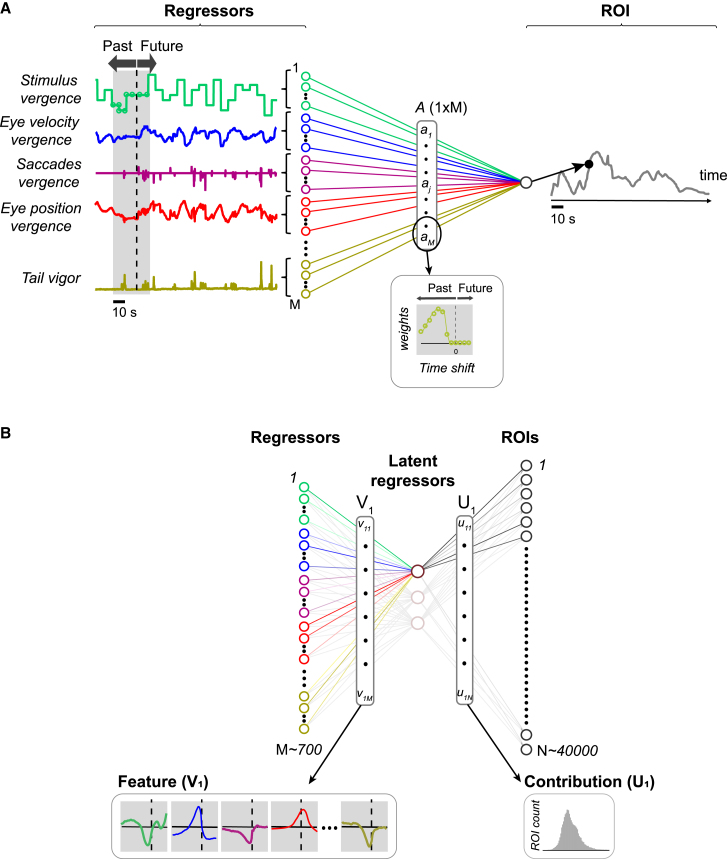
IMAGE

Figure 3

ID
ZDB-IMAGE-231002-15
Source
Figures for Feierstein et al., 2023
Image
Figure Caption

Figure 3

Regression models

(A) Multiple linear regression model for a single ROI. For each original variable (only a subset shown here, see Figure S2), the regression model finds a set of weights that corresponds to the contribution of the variable at different time points (gray window, left) to ROI activity at the present time point (black dot, right). Inset shows the weights for one of the variables. Dotted line corresponds to no time-shift.

(B) Reduced-rank regression. Each time-shifted regressor is first mapped onto a set of latent regressors. The pattern of weights (V1) that determines the mapping for one latent regressor is called a feature (left inset, each regressor is represented in one color). In turn, the latent regressor is associated with a pattern of ROI activity, determined by its contribution weights (U1). Right inset shows distribution of the U1 values (U1 contribution) for this example feature. This distribution illustrates how strongly the latent regressor associated with this feature is expressed across the population.

See also Figures S2 and S3.

Acknowledgments
This image is the copyrighted work of the attributed author or publisher, and ZFIN has permission only to display this image to its users. Additional permissions should be obtained from the applicable author or publisher of the image. Full text @ Curr. Biol.