IMAGE

Figure 2

ID
ZDB-IMAGE-231002-14
Source
Figures for Feierstein et al., 2023
Image
Figure Caption

Figure 2

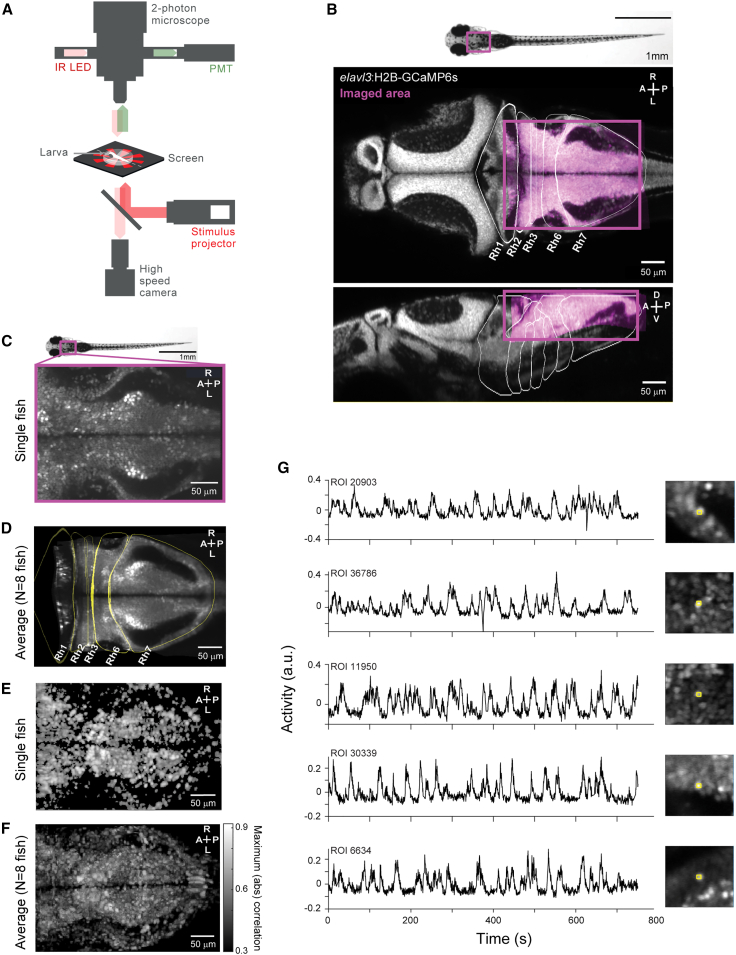
Activity related to behavior is widespread in the zebrafish hindbrain

(A) Schematic of experimental setup (see STAR Methods), showing simultaneous brain imaging, behavior monitoring, and visual stimulus presentation.

(B) Representative plane highlighting the imaged region (magenta) overlaid on the corresponding plane of the Z-brain atlas.47 Top, dorsal view. Bottom, sagittal view.

(C) Example plane of the imaged area in a representative fish.

(D) Example plane of the average image stack across eight fish (see STAR Methods).

(E) Maximum absolute correlation value with any of the expanded set of behavioral regressors (see STAR Methods) for an example fish (maximum projection of the imaged stack).

(F) Average maximum absolute correlation maps across eight fish, after registration to an internal template (see STAR Methods; maximum projection of average stack). Correlation maps are thresholded at 0.3 absolute correlation value.

(G) Example traces of ROIs used in the analysis.

See also Table S1, and Video S2.

Acknowledgments
This image is the copyrighted work of the attributed author or publisher, and ZFIN has permission only to display this image to its users. Additional permissions should be obtained from the applicable author or publisher of the image. Full text @ Curr. Biol.