
|
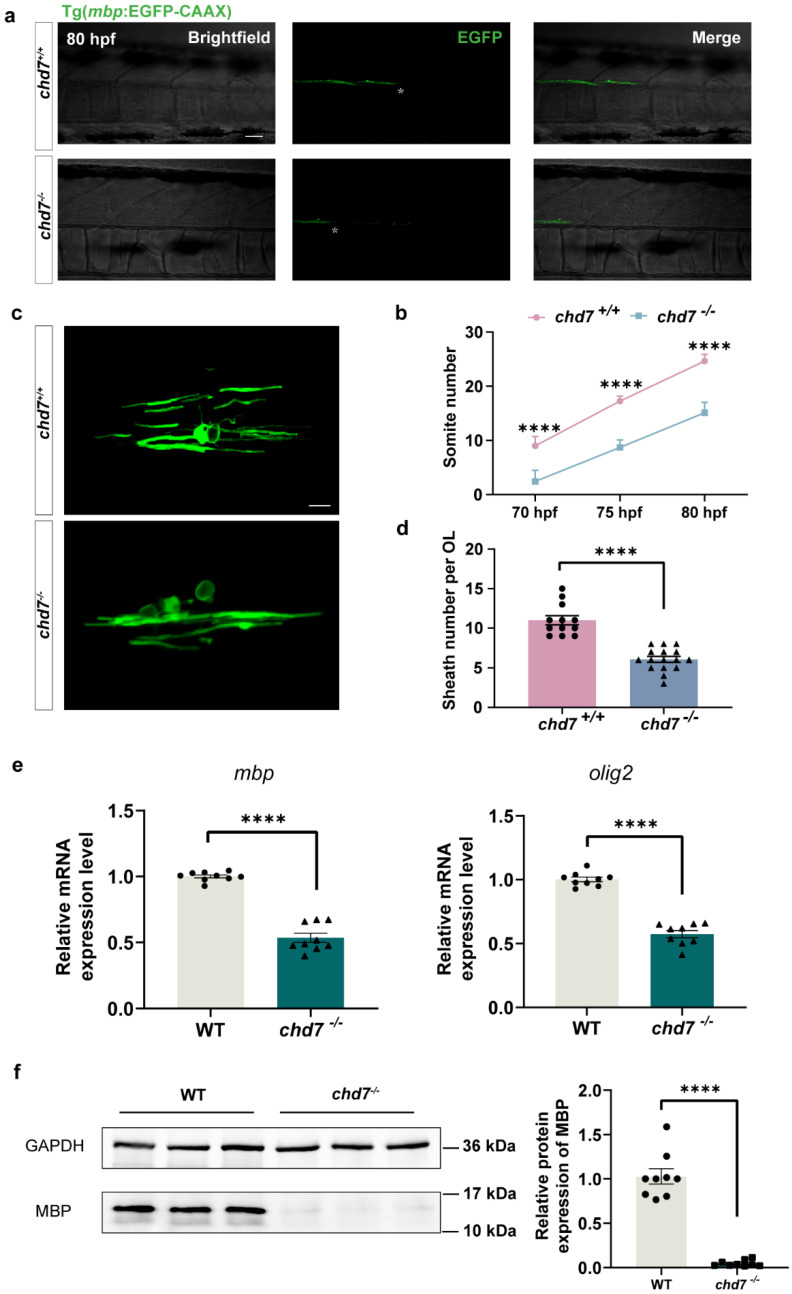
Figure 5
Chd7 knockout mutant affected the myelin potential of OL. (a) The most posterior myelin sheath in the spinal cord at 80 hpf during myelination of the Mauthner axon between chd7+/+ and chd7−/− groups. Asterisks represent the terminals of myelin-coated axons. Scale bars:100 μm. (b) The most posterior myelin sheath at 70 hpf was somite 9 in the wild-type and somite 2 in mutant groups; at 75 hpf was somite 17 in the wild-type and somite 9 in mutant groups; and at 80 hpf was somite 25 in the wild-type and somite 15 in mutant groups. (c) Typical confocal imaging of individual oligodendrocytes labeled with plasmid mbp-EGFP-CAAX in the wild-type and mutant groups. Scale bar: 50 μm. (d) Number of individual oligodendrocyte-wrapped myelin segments in the wild-type and mutant groups. Wild type: 12 cells derived from 10 juveniles; mutant group: 16 cells derived from 9 juveniles. (e) Real-time Q-PCR results of gene olig2 and mbp. (f) Protein MBP was decreased in knockout group as shown by Western blot quantification. Data were shown as mean ± sem. **** p < 0.0001, unpaired Student’s two-tailed t-test.