
|
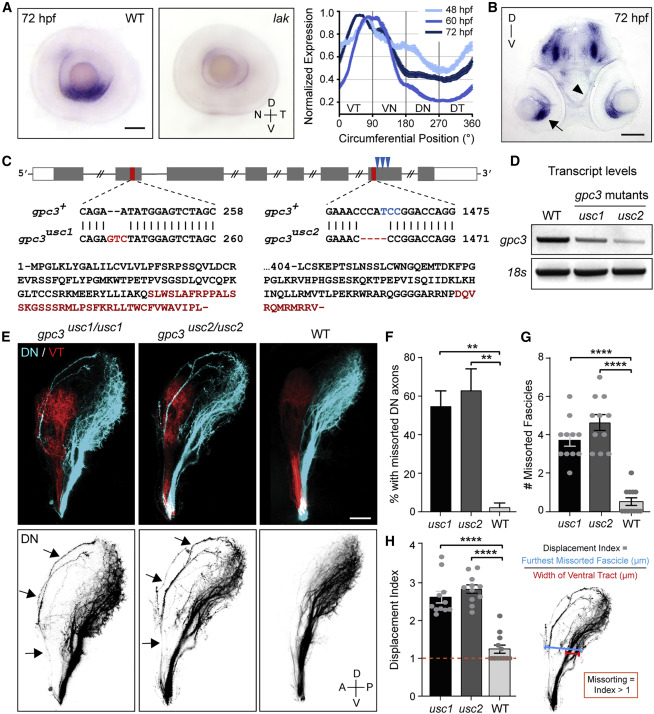
Fig. 2 gpc3 is selectively expressed by ventral RGCs and is required for pruning missorted dorsal axons
(A) Lateral views of eyes dissected from WT and lak mutant embryos lacking RGCs and stained for gpc3 by ISH at 72 hpf. Gpc3 is selectively detected in ventral RGCs. Scale bar: 50 μm. N, nasal; T, temporal; D, dorsal; V, ventral. Quantification of gpc3 expression in the RGC layer at 48, 60, and 72 hpf reveals that gpc3 expression is restricted to ventral RGCs at the time missorted dorsal axons get pruned.
(B) Coronal section of an embryo stained for gpc3 by ISH at 72 hpf. Gpc3 is strongly detected in ventral RGCs (arrow) but not along the optic tract (arrowhead). Scale bar: 100 μm.
(C) Schematic of gpc3 gene and corresponding mutations in gpc3usc1 and gpc3usc2 mutants. Red bars indicate the position of mutations in exons 2 and 7. Blue arrows indicate the three codons encoding HS attachment sites in exon 7. Protein sequences show the missense amino acids and premature stop generated in each allele.
(D) Analysis of gpc3 transcript levels in WT and gpc3 mutants by RT-PCR at 4 dpf. Gpc3 transcripts are reduced by 48.4% and 68.4% in gpc3usc1 and gpc3usc2 mutants, respectively, indicating a non-sense-mediated decay of gpc3 mRNA in gpc3 mutants. One-way ANOVA with Tukey’s post-hoc test, p ˂ 0.005.
(E) Pre-target sorting of DN and ventrotemporal (VT) retinal axons along the optic tract at 4 dpf. DN axons missort along the dorsal branch in gpc3 mutants (arrows). Scale bar: 50 μm.
(F) Percentage of larvae with missorted DN axons at 4 dpf. Chi-squared test, X2 (2, N = 51) = 11.58, p = 0.0031.
(G) Number of missorted DN axon fascicles in mutant larvae with sorting defects. One-way ANOVA with Tukey’s post-hoc test, p ˂ 0.0001.
(H) Quantification of the displacement index in mutant larvae with sorting defects. One-way ANOVA with Tukey’s post-hoc test, p ˂ 0.0001. n = 11 gpc3usc1 and 11 gpc3usc2. Error bars: standard errors.
See also Figures S2–S4.