
|
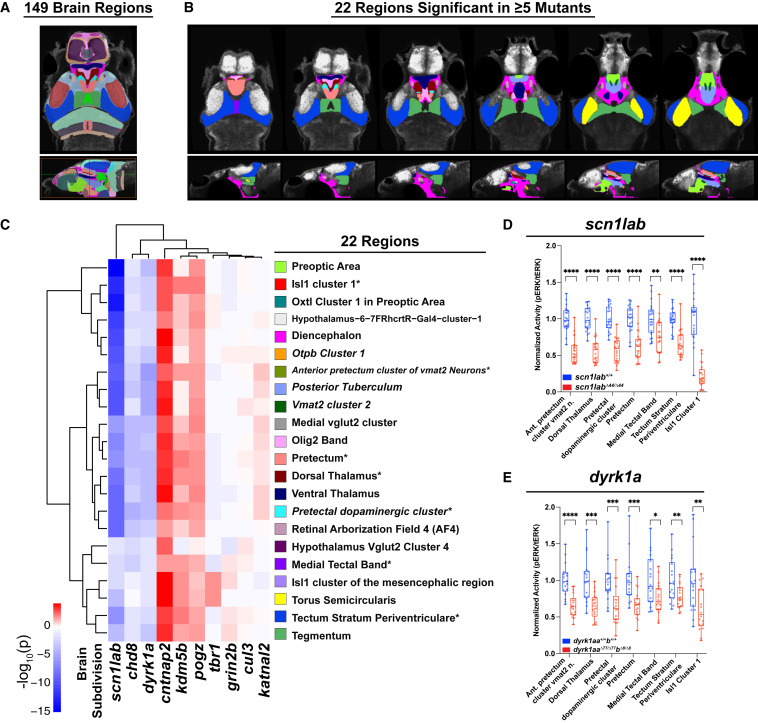
Fig. 5 Mutant activity phenotypes converge on 22 brain regions
(A) The 149-region zebrafish brain atlas derived from Randlett et al. (2015).42
(B) The 22 regions with significant differences in baseline brain activity in at least five mutants. Region names are shown in (C). Images shown from left to right represent sequential slices: axial views, top row, dorsal to ventral; sagittal views, bottom row, lateral to medial.
(C) Hierarchical clustering of 22 regions with significant differences in baseline brain activity in at least five mutants by linear mixed models (LMM) (p < 0.05). Five regions involve dopaminergic signaling (italics): posterior tuberculum, pre-tectal dopaminergic cluster, vmat2 cluster 2, anterior pretectum cluster of vmat2 neurons, otpb cluster 1. Colors shown to next to each region name refer to (B). ∗The seven regions with significant differences in baseline activity in at least six mutants (Figures S5B and S5C). Hierarchical clustering of 131 regions with significant differences in activity in at least two mutants by LMM is shown in Figure S5A. For a list of significant regions by mutant, see Table S5.
(D and E) Normalized brain activity (pERK/tERK) in scn1labΔ44/Δ44 (D) and dyrk1aaΔ77/Δ77dyrk1abΔ8/Δ8 (E) versus background-matched wild-type fish in the seven brain regions that show significant differences in at least six mutants. Heterozygous phenotypes are shown in Figures S5D and S5E. ∗∗∗∗p < 0.0001, ∗∗∗p < 0.001, ∗∗p < 0.01, ∗p < 0.05 (one-way ANOVA).