
|
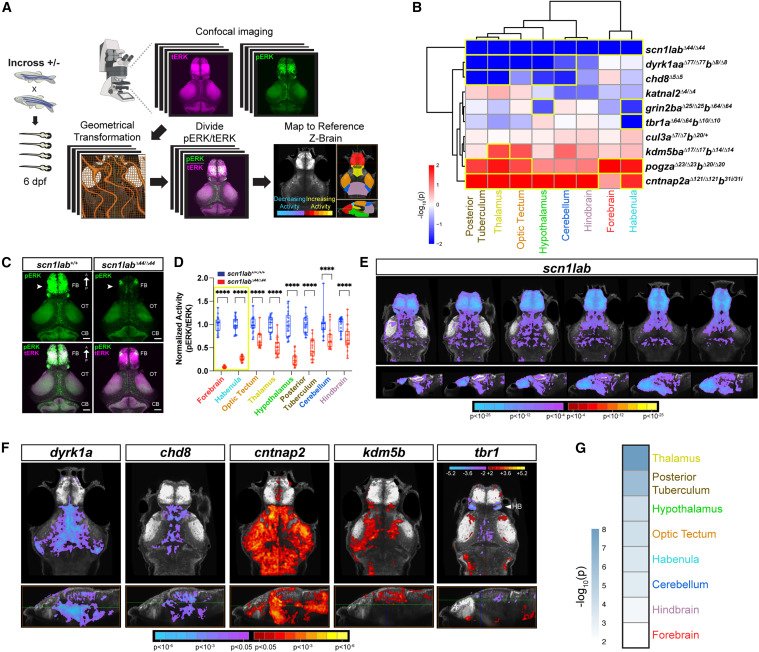
Fig. 4 Altered baseline brain activity in zebrafish ASD gene mutants
(A) Whole-brain activity mapping pipeline (STAR Methods).
(B) Hierarchical clustering of regional brain activity (pERK/tERK) in mutant versus background-matched wild-type fish using linear mixed models (LMM). Each rectangle in the clustergram represents the signed -log10-transformed p values from LMM (red, increased in mutant; blue, decreased in mutant). Regions with significant activity differences by LMM (p < 0.05) are outlined in yellow. p-values for all homozygous and heterozygous mutants are shown in Figure S4A. For pERK/tERK ratios by region for all fish, see Table S4.
(C) pERK- (top) and merged pERK- and tERK-immunostained brains of scn1labΔ44/Δ44 and wild-type larvae at 6 dpf. Note the decrease in pERK staining in the mutant forebrain (arrowheads). Dorsal views. FB, forebrain; OT, optic tectum; CB, cerebellum. Scale bar, 50 μm.
(D) Normalized regional activity (pERK/tERK) in scn1labΔ44/Δ44 (n = 23) and background-matched wild-type (n = 21). ∗∗∗∗p < 0.0001 (one-way ANOVA).
(E) Voxel-wise Z score pERK/tERK values representing brain activity differences in scn1labΔ44/Δ44 versus background-matched wild-type larvae. Images shown from left to right represent sequential slices: axial views, top row, dorsal to ventral; sagittal views, bottom row, lateral to medial. Scale bar, Z score (red/yellow, increased in mutant; cyan/purple, decreased in mutant). Results are shown at p < 0.05 whole-brain family-wise error (FWE) corrected with an initial p threshold of 0.0001.
(F) Voxel-wise Z score pERK/tERK values representing brain activity differences for the following lines: dyrk1aaΔ77/Δ77dyrk1abΔ8/Δ8, chd8Δ5/Δ5, cntnap2aΔ121/Δ121cntnap2b31ins/31ins, kdm5baΔ17/Δ17kdm5bbΔ14/Δ14, and tbr1aΔ64/Δ64tbr1bΔ10/Δ10. Axial views, top row; sagittal views, bottom row. The horizontal green line in the sagittal view indicates the slice shown in the axial view. Scale bar represents Z score (red/yellow, increased in mutant; cyan/purple, decreased in mutant). Results are shown at p < 0.05 whole-brain FWE corrected with an initial p threshold of 0.05 for all mutants except tbr1, which is not FWE corrected because significance did not meet cluster correction. tbr1 mutants display significantly decreased activity in the habenula (HB) (arrowhead) by LMM (B). For the number of animals used in imaging experiments, see STAR Methods (average n = 22–24 per genotype in two to three independent clutches).
(G) Genotype-level p values for each brain region are combined for all homozygous mutants and cul3aΔ7/Δ7cul3bΔ20/+, excluding scn1lab, using Fisher’s method. The scale represents the -log10-transformed combined p value. The thalamus shows the most significant difference in activity (p = 9.55 × 10⁻⁹, Fisher’s combined probability test).