
|
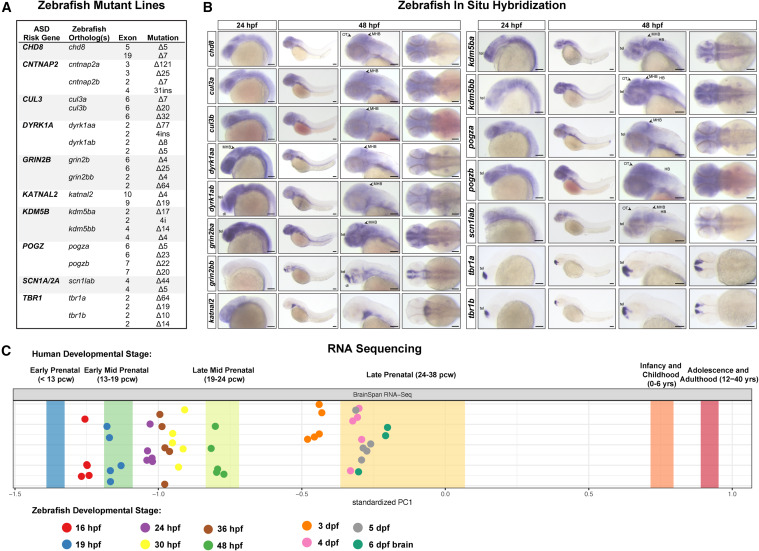
Fig. 1 ASD gene expression in zebrafish and mutant generation
(A) Zebrafish mutant lines. See Table S and Figures S1A–S1I for mutant sequences.
(B) Whole-mount RNA in situ hybridization of ASD gene orthologs in zebrafish at 24 and 48 hpf. For cntnap2a and cntnap2b, see Hoffman et al. (2016).21 Lateral views are shown in the left three panels; dorsal views are shown in the right panel. Anterior to the left; tel, telencephalon; di, diencephalon; MHB, midbrain-hindbrain boundary; OT, optic tectum; HB, hindbrain. Scale bars, 0.1 mm.
(C) Mapping zebrafish RNA-seq datasets30 to the human BrainSpan developmental transcriptome RNA-seq dataset 31 using principal component analysis.13 Principal component 1 (PC1) is plotted. Bands represent the 95% confidence interval of the mean PC1 value for human developmental stages. Biological replicates of zebrafish samples are shown as points. pcw, postconception weeks; hpf, hours post-fertilization; dpf, days post-fertilization. See Figure S1L for the full PCA