
|
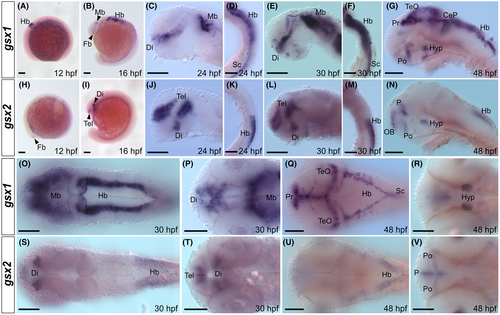
Fig. 2 Expression of gsx1 and gsx2 in embryonic zebrafish is dynamic and unique. (A-G) Lateral mounts showing expression of gsx1 from 12 to 48 hpf. (H-N) Lateral mounts showing expression of gsx2 from 12 to 48 hpf. (O-R) Dorsal (O and Q) and ventral (P and R) mounts showing expression of gsx1 from 30 to 48 hpf. (S-V) Dorsal (S and U) and ventral (T and V) mounts showing expression of gsx2 from 30 to 48 hpf. A, B, H, and I are dissecting scope images and scale bar represents 500 μm. Remaining images are compound scope images taken at ×20 with samples mounted under cover glass and anterior facing left, eyes removed in lateral views. Scale bars represent 100 μm. CeP, cerebellar plate; Di, diencephalon; Fb, forebrain; Hb, hindbrain; Hyp, hypothalamus; Mb, midbrain; OB, olfactory bulb; P, pallium; Po, preoptic area; Pr, pretectum; Sc, spinal cord; Tel, telencephalon; TeO, optic tectum