
|
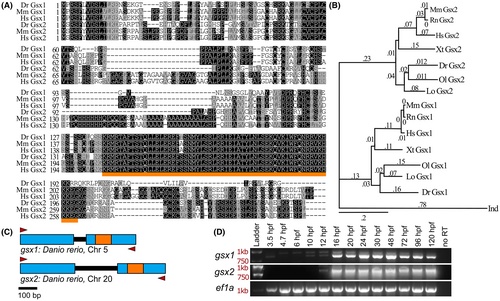
Fig. 1 Gsx1 and Gsx2 are conserved across vertebrates and expressed in zebrafish from embryonic stages through adulthood. (A) Amino acid sequence alignment of zebrafish, mouse, and human Gsx1 and Gsx2. Dr, Danio rerio; Mm, Mus musculus; Hs, Homo sapiens. Identical amino acids are shaded in black, similar amino acids are shaded in gray, and the region encoding the conserved DNA-binding homeodomain is underlined in orange. (B) Rooted phylogenetic tree displaying the clustered relationship of published Gsx1 and Gsx2 protein sequences as well as a divergence from the Drosophila ortholog Ind. Values represent distance scores. Dm, Drosophila melanogaster; Lo, Lepisosteus oculatus; Ol, Oryzias latipes; Xt, Xenopus tropicalis. (C) Schematic of the zebrafish gsx1 and gsx2 gene bodies. Blue boxes represent exons, black lines represent introns, and orange boxes represent the region encoding the homeodomain. Red arrowheads represent RT-PCR primer annealing sites. (D) Agarose gels showing full-length cDNA transcripts of zebrafish gsx1 (top), gsx2 (middle), and ef1a (bottom) at specific ages. Red text indicates ladder sizes. Upper bands in the gsx1 gel image represents trace genomic DNA that includes the 89 bp intron