
|
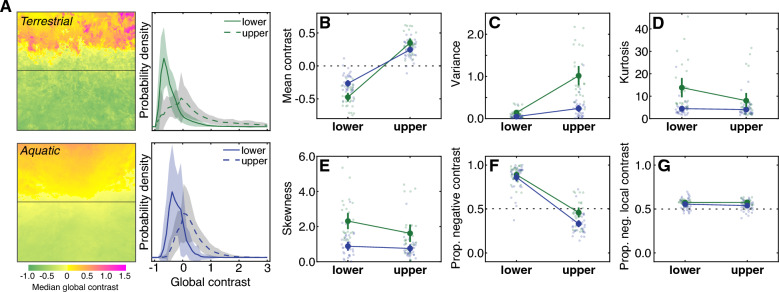
Figure 3
Contrast distributions differ in the upper and lower visual fields of both environments. (A) Heatmaps show the median contrast across the visual field for the terrestrial (upper) and aquatic (lower) samples. Line plots show the average probability density of contrast in the upper and lower visual fields. Shaded regions indicate plus or minus one standard deviation of the mean. (B–E) Statistics of the contrast distributions, including the mean (B), variance (C), kurtosis (D), skewness (E), proportion negative global contrast (F) and proportion negative contrast based on the difference of Gaussians local contrast operator (G). Values for individual samples are plotted as smaller circles; mean and 95% confidence intervals are plotted as large circles and vertical lines.