
Image
|
Figure Caption
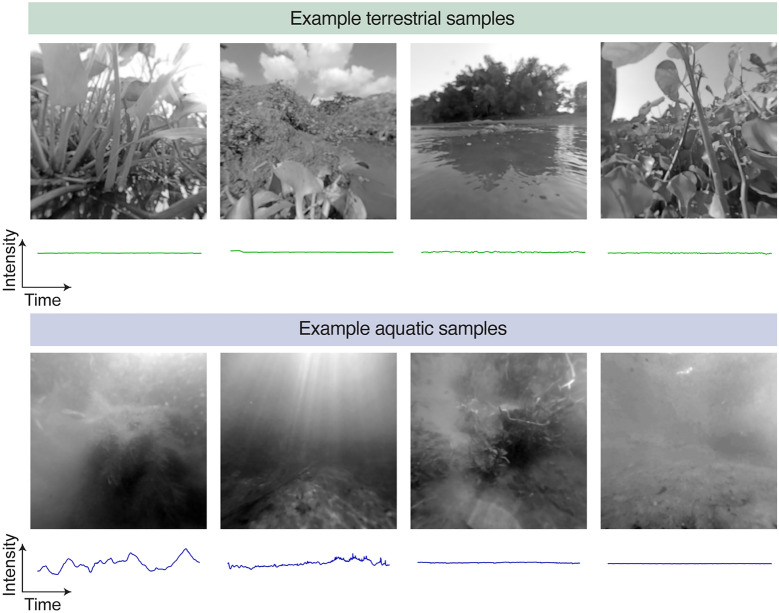
Figure 1
Examples of the first frame and the average change in intensity over time from the terrestrial and aquatic video samples. Each image shows the green (G) channel of one sample's first frame. The images are shown as log light intensity for visibility. Below each image is the average intensity as a function of time for the same sample. For all temporal plots, the abscissa is time with a span of 10 s, and the ordinate is intensity on an arbitrary scale.
Acknowledgments
This image is the copyrighted work of the attributed author or publisher, and
ZFIN has permission only to display this image to its users.
Additional permissions should be obtained from the applicable author or publisher of the image.
Full text @ Sci. Rep.