
|
Fig 3
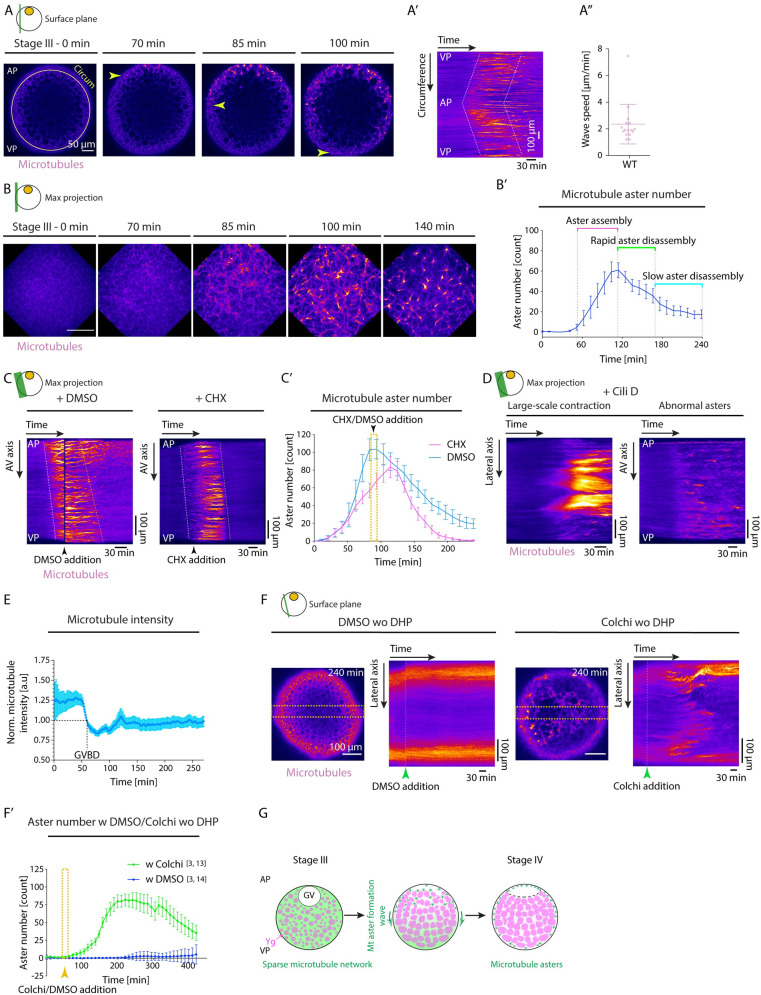
(A) Fluorescence images of stage III Tg(Xla.Eef1a1:dclk2a-GFP) oocytes labeling microtubules before (stage III) and 70, 85, and 100 min after maturation onset. Arrowheads mark the propagating front of the microtubule aster formation wave. The circumferential (Circum) line in the first panel indicates the region used for acquiring the kymograph in (A’). (A’) Kymograph acquired along the circumference of the oocyte shown in (A) as a function of time. Dashed lines mark the leading and trailing edges of the microtubule aster formation wave. (A”) Speed of microtubule aster formation wave along the oocyte circumference, measured from kymographs as shown in (A’); N = 9 experiments, n = 16 oocytes. See Table A in S3 Data for underlying data. (B) Maximum fluorescence intensity projection of high-resolution images of stage III Tg(Xla.Eef1a1:dclk2a-GFP) oocytes labeling microtubules during consecutive stages before (stage III) and 70, 85, 100, and 140 min after maturation onset. (B’) Microtubule aster number as a function of time. Aster assembly during the second hour after maturation onset is followed by initially rapid and then slower disassembly phases (N = 2, n = 8). See Table B in S3 Data for underlying data. (C) Kymographs acquired along the AV axis of Tg(Xla.Eef1a1:dclk2a-GFP) oocytes exposed to DMSO (control, left) or 700 μM CHX (right) as a function of time. Arrowheads mark the time point of oocyte exposure to DMSO/CHX. Dashed lines mark the leading and trailing edges of the microtubule aster formation wave. (C’) Microtubule aster number as a function of time for Tg(Xla.Eef1a1:dclk2a-GFP) oocytes exposed to DMSO (cyan, N = 2, n = 8) or CHX (magenta, N = 2, n = 9). The yellow box indicates the time window of oocyte exposure to DMSO or CHX in the respective experiments. See Table C in S3 Data for underlying data. (D) Kymographs acquired along the lateral (left) and AV (right) axis of exemplary Tg(Xla.Eef1a1:dclk2a-GFP) oocytes exposed to Cili D as a function of time demonstrating large-scale contractions and abnormal aster formation, respectively. (E) Microtubule intensity measured in a 50 pix-wide region at the blastodisc in the vicinity of the GV over time normalized to intensity values at GVBD onset (N = 2, n = 9). See Table D in S3 Data for underlying data. (F) Fluorescent images of stage III Tg(Xla.Eef1a1:dclk2a-GFP) oocytes exposed to DMSO (control, left) or Colchi (right) for 240 min in the absence of DHP (immature oocyte). The orange dashed boxes denote the lateral regions used for obtaining the kymographs shown on the right. The panels on the right indicate the kymographs of microtubule intensity along the lateral axis of the oocytes shown on the left as a function of time. The green arrowheads denote the time point of oocyte exposure to DMSO or Colchi. (F’) Microtubule aster number as a function of time for oocytes exposed to DMSO (blue, N = 3, n = 14) or Colchi (green, N = 3, n = 13) without DHP (immature oocytes). The arrowhead denotes the time point of oocyte exposure to DMSO or Colchi. See Table E in S3 Data for underlying data. (G) Schematic summarizing the microtubule network transformation taking place during oocyte maturation. A uniform microtubule network encompassing the ooplasm of the immature oocytes reorganizes into numerous microtubule asters in a wave-like fashion from the AP to the VP of the oocyte. This network transformation relies on the partial depolymerization of the microtubule network initiated by GVBD at the AP of the oocyte. Schematics in each panel demarcate the imaging plane used for obtaining the images in that panel. Error bars, SEM. AP, animal pole; AV, animal-vegetal; CHX, Cycloheximide; Cili D, Ciliobrevin D; Colchi, Colchicine; GV, germinal vesicle; GVBD, germinal vesicle breakdown; VP, vegetal pole; WT, wild-type; Ygs, yolk granules.