IMAGE

Fig 1

ID
ZDB-IMAGE-230622-27
Source
Figures for Shamipour et al., 2023
Image
Figure Caption

Fig 1 Rearrangements of the ooplasm during zebrafish oocyte maturation.

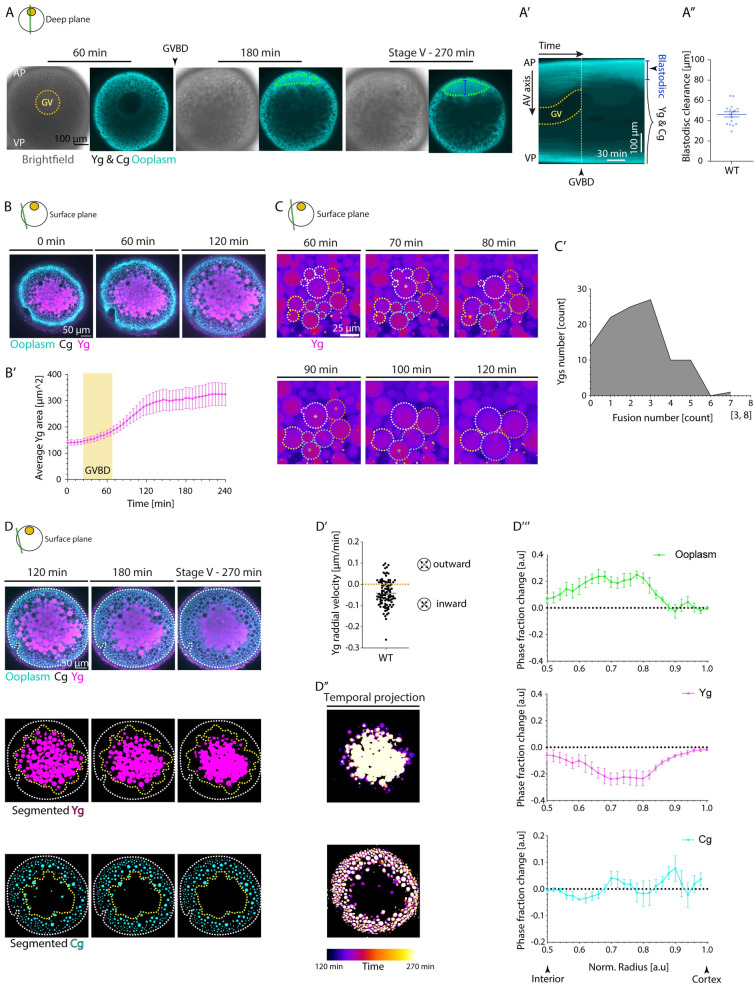
(A) Brightfield (left) and fluorescence (right) images of stage III Tg(hsp:clip170-GFP) oocytes labeling the ooplasm during oocyte maturation at 60, 180, and 270 min after maturation induction with the DHP hormone. Dashed yellow circle highlights the GV contour, and arrowhead denotes the GVBD onset. The green ROIs indicate the blastodisc region, and blue line marks the blastodisc height as measured in Fig 1A”. Ygs and Cgs are depicted by their exclusion of ooplasmic signal. (A’) Kymograph acquired along the AV axis of the oocyte shown in Fig 1A as a function of time. The yellow dashed lines outline the GV contour and the dashed white line marks the time point of GVBD. The blue zone demarcates the blastodisc region. (A”) Blastodisc clearance, measured as the height of blastodisc at the end of the maturation process as shown in Fig 1A and 1A’, for WT oocytes (N = 2 experiments, n = 16 oocytes). See Table A in S1 Data for underlying data. (B) Fluorescence images of stage III Tg(hsp:clip170-GFP) oocytes labeling ooplasm (cyan) and exposed to Lysotracker to mark Yg (magenta) and Cg (black, identified by their exclusion of both Clip-170-GFP and Lysotracker) before maturation (stage III) and 60 and 120 min after maturation onset. (B’) Average Yg area (N = 3, n = 20) over time. Yellow box indicates the period during which GVBD takes place. See Table B in S1 Data for underlying data. (C) Fluorescence images of stage III oocytes exposed to Lysotracker to label Yg (magenta) at 60–120 min after maturation onset. Dashed lines with the same color demarcate the outline of Yg that will undergo fusion. Asterisks mark the time point of fusion. (C’) Histogram of Yg fusion events during oocyte maturation (N = 3, n = 8). See Table C in > S1 Data for underlying data. (D) Fluorescence images of stage III Tg(hsp:clip170-GFP) oocytes labeling ooplasm (cyan) and exposed to Lysotracker to mark Yg (magenta) and Cg (black) at 120, 180, and 270 min after maturation onset (first row). Images in the bottom rows show segmented Yg and Cg obtained from the images in the first row. White dashed lines mark the oocyte outline. Yellow dashed lines denote the initial distribution of Yg in the second row and the final distribution of Cg in the third row. (D’) Yg radial velocity between 120 and 270 min after maturation onset (N = 2, n = 8). See Table D in S1 Data for underlying data. (D”) Temporal projection of segmented Yg (top) and Cg (bottom) of the oocyte shown in (D) between 120 and 270 min after maturation onset, illustrating the inward motion of Yg and the outward movement of Cg. (D”’) Changes in phase fractions for ooplasm (top, green), Yg (middle, magenta), and Cg (bottom, cyan) between 120 and 270 min after maturation onset. Normalized (norm) radii of 0.5 and 1 correspond to the oocyte interior and cortex, respectively (N = 3, n = 6). See Table E in S1 Data for underlying data. Schematics demarcate the imaging plane used for obtaining the images in each panel. Note that in panel (A), processes deeper within the oocyte are captured, while in panels (B-D), more superficial parts of the oocyte are captured. Error bars, SEM. AP, animal pole; AV, animal-vegetal; Cgs, cortical granules; GV, germinal vesicle; GVBD, germinal vesicle breakdown; VP, vegetal pole; WT, wild-type; Ygs, yolk granules.

Acknowledgments
This image is the copyrighted work of the attributed author or publisher, and ZFIN has permission only to display this image to its users. Additional permissions should be obtained from the applicable author or publisher of the image. Full text @ PLoS Biol.