IMAGE

Figure 3.

ID
ZDB-IMAGE-230622-22
Source
Figures for Kanyo et al., 2023
Image
Figure Caption

Figure 3.

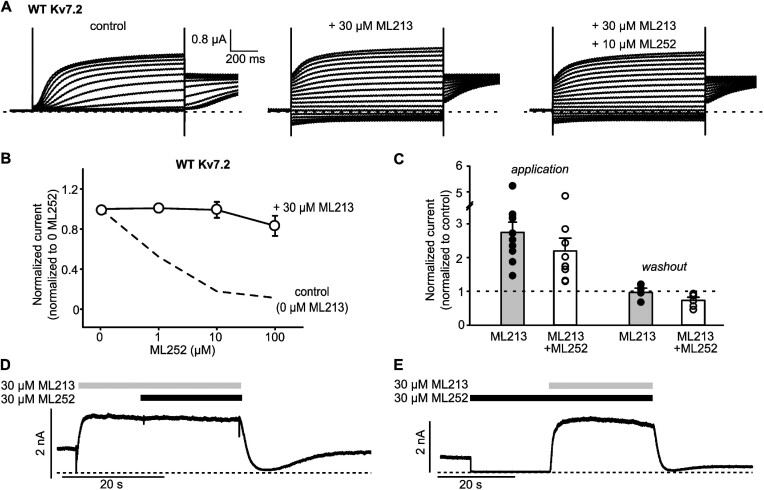
The pore-targeted activator ML213 weakens ML252 inhibition of Kv7.2. (A) Exemplar records of Kv7.2 expressed in Xenopus oocytes, treated with ML213 and ML252 as indicated. Oocytes were held at −80 mV and pulsed between −140 and +40 mV in 10 mV steps. (B) WT Kv7.2 concentration response to ML252, collected in the presence (open circles, n = 4–6) or absence (dashed line, data from Figure 1F) of ML213. Currents were measured at +20 mV and normalized to current in 0 μm ML252. (C to E) Fast-perfusion patch-clamp recordings using HEK cells showing ML213 competition with ML252. (C) Normalized Kv7.2 current magnitudes from HEK293 cells upon application or washout with indicated combinations of 30 μm ML213 and 30 μm ML252, normalized to currents measured in the absence of drugs and collected as depicted in panels D and E (application, n = 9 for ML213, n = 9 for ML213 + ML252) (washout, n = 4 for ML213, n = 6 for ML213 + ML252). No statistical difference was found for inhibition by ML213 vs. ML213 + ML252 (P = .122, Student’s t-test). (D and E) Exemplar patch-clamp recordings of HEK293 cells expressing WT Kv7.2. Cells were held at +20 mV throughout the recording and combinations of ML252 and ML213 were applied where indicated.

Acknowledgments
This image is the copyrighted work of the attributed author or publisher, and ZFIN has permission only to display this image to its users. Additional permissions should be obtained from the applicable author or publisher of the image. Full text @ Function (Oxf)