IMAGE

Figure 7

ID
ZDB-IMAGE-230617-70
Source
Figures for He et al., 2023
Image
Figure Caption

Figure 7

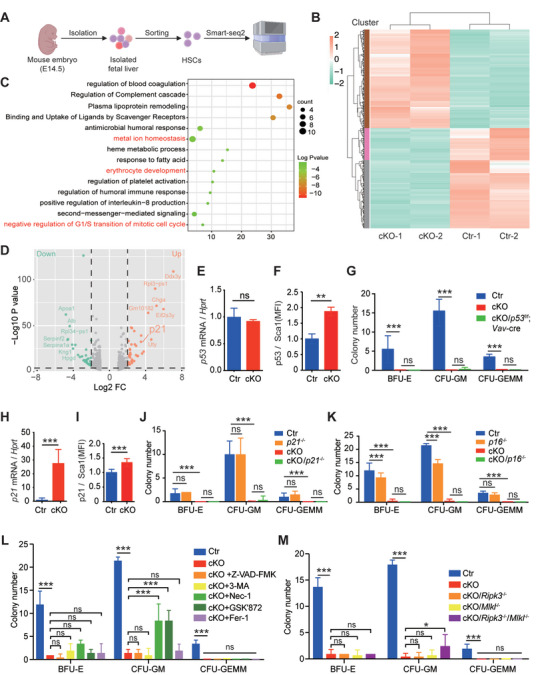
Inhibiting necroptosis partially restores the colony‐forming capacity of Slc39a10‐deficient HSCs. A) Schematic diagram depicting the strategy of sorting fetal LT‐HSCs from control and cKO embryos at E14.5 and performing RNA‐seq analysis. B) Heat map showing genes that are differentially expressed between fetal LT‐HSCs obtained from control and cKO mice; downregulation and upregulation (defined as a log2 fold change >1 or <−1 and p < 0.05) are shown in green and red, respectively. C) Gene Ontology (GO) analysis of the RNA‐seq data showing the top 15 enriched pathways in fetal LT‐HSCs between control and cKO mice (defined as a log2 fold change >1.3 or ←1.3 and p < 0.05). The pathways involved in metal ion homeostasis, erythrocyte development, and negative regulation of G1/S transition of the mitotic cell cycle are written in red. D) Volcano plot of the RNA‐seq data, showing the differentially expressed genes in fetal LT‐HSCs between control and cKO mice. The green and red dots indicate significantly downregulated and upregulated genes (defined as a log2 fold change >2 or <−2 and p < 0.05) respectively, while gray dots indicate genes that were not significantly upregulated or downregulated; the p21 gene is indicated. E,F) Summary of normalized p53 mRNA (E) and p53 protein (F) levels measured in LT‐HSCs obtained from control and cKO embryos at E14.5 (n = 5 and 3 for the mRNA and protein groups, respectively). G) In vitro colony assays were performed using fetal livers obtained from control, cKO, and Slc39a10fl/fl; p53fl/fl; Vav‐Cre+ double‐knockout embryos at E14.5; colony numbers were measured on day 12 (n = 4 per group). H‐I, Summary of normalized p21 mRNA (H) and p21 protein (I) levels measured in LT‐HSCs obtained from control and cKO embryos at E14.5 (n = 5 and 3 for the mRNA and protein groups, respectively). J,K) In vitro colony assays were performed using fetal livers obtained from control, cKO, cKO/p21−/‐ (J), and cKO/p16−/‐ (K) embryos at E14.5; colony numbers were measured on day 12 (n = 4 per group). L) Summary of CFUs formed by untreated control and cKO FL‐HSCs and cKO FL‐HSCs treated with 50 µm Z‐VAD‐FMK, 100 µm 3‐MA, 10 µm necrostatin‐1 (Nec‐1), 2.5 µm GSK’872, or 30 µm ferrostatin‐1 (Fer‐1) (n = 4 per group). M) Summary of CFUs formed by LT‐HSCs obtained from control, cKO, cKO/Ripk3−/−, cKO/Mlkl−/−, and cKO/Ripk3−/−/Mlkl−/− embryos at E14.5 (n = 3 per group). Data in this figure are represented as mean ± SD. The data in (E–I) were analyzed using a 2‐tailed, unpaired Student's t‐test, and the data in (J–M) were analyzed using a one‐way ANOVA with Tukey's post hoc test (for multi‐group comparisons). *p < 0.05; **p < 0.01; ***p < 0.001, and ns, not significant.

Acknowledgments
This image is the copyrighted work of the attributed author or publisher, and ZFIN has permission only to display this image to its users. Additional permissions should be obtained from the applicable author or publisher of the image. Full text @ Adv Sci (Weinh)