IMAGE

Fig. 2.

ID
ZDB-IMAGE-230617-19
Source
Figures for Ezhkova et al., 2023
Image
Figure Caption

Fig. 2.

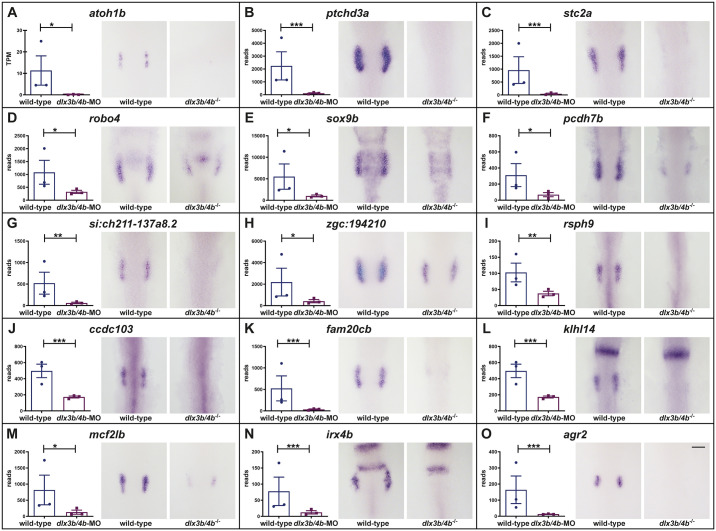
Dlx3b/4b controls the expression of numerous known and novel transcripts in the OEPD. In comparison to wild-type siblings, RNAseq and in situ hybridization show a downregulation of atoh1b (A), ptchd3a (B), stc2a (C), robo4 (D), sox9b (E), pcdh7b (F), si:ch211-137a8.2 (G), zgc:194210 (H), rsph9 (I), ccdc103 (J), fam20cb (K), klhl14 (L), mcf2lb (M), irx4b (N) and agr2 (O) in the OEPD of dlx3b/4b mutants at the six-somite stage (12 hpf). Dorsal views, anterior to the top. Scale bar: 100 µm. Except for atoh1b, plots show the read counts of the individual genes including standard deviation. Expression levels of atoh1b are given in transcripts per million (TPM) because it is annotated to belong to chrUn_KN150642v1 and mapping was done only against known chromosomes. Significance was based on the padj values which were calculated to control the false discovery rate and was assigned to the following ranges: ***: 0-0.001; **: 0.001-0.01; *: 0.01-0.01; not significant: 0.1-1.0.

Acknowledgments
This image is the copyrighted work of the attributed author or publisher, and ZFIN has permission only to display this image to its users. Additional permissions should be obtained from the applicable author or publisher of the image. Full text @ Biol. Open